Approaches to exploratory data analysis using dataARC
A non-exhaustive compilation of key strategies
Richard J. Bankoff & Andrés G. Mejía Ramón
So, you have decided to use dataARC’s infrastructure to enable your research on a question related to the North Atlantic. Fantastic; welcome!
Regardless of the specifics of your research focus, you will have some choices to make, both in your initial collection of data, and then at various stages of the analysis. The wide array of tools dataARC offers to filter and select particular data and examine the links between them is what makes the platform powerful, but the multiplicity of approaches it offers can be somewhat overwhelming for the new user. Should you start searching for data by applying some spatial filters using the map function, or by restricting the temporal span of the returned data with the timeline tool – or maybe it would be better to gather all features associated with an interesting concept in the Concept Map? What is the best way to download these data, and how do they relate to one another internally?
While each of these questions can be answered multiple valid ways (as covered in extensive and interactive detail elsewhere on this site; see also #6 below), we have here compiled a few general recommendations to serve as guiding principles for the interested user as they explore dataARC’s tools and datasets.
1: Start your search as broadly as possible
When presented with the option of filtering data through a simple and intuitive interface such as the dataARC UI, most researchers are thrilled. At last, a way to exclude irrelevant data from the start, avoiding countless “omit” commands later in the process!
Unfortunately, understandable as this impulse is, if you indulge it too heavily you will restrict the utility you get from dataARC, potentially severely. Pruning datasets excessively from the start will eliminate much of the utility of the concept map system, whose combinators connect features from disparate sites and datasets through shared concepts.
This is not to say that (e.g.) a zooarchaeologist who is interested in whale bones from Iceland’s settlement period shouldn’t necessarily make use of the spatial or temporal filter features to exclude Danish specimens from the 19th century; such bounds are reasonably likely not to incidentally miss much data of interest for the specified question. However, if that same researcher were to restrict their query further – say, to the Whales database – they would almost certainly miss data from (e.g.) the Strategic Environmental Archaeology Database (SEAD) that would be useful in fleshing out the broader contemporaneous environment.
Likewise, a bounding box drawn in the UI’s spatial filter is perfectly fine for selecting all of the data from sites in Greenland, or even around an area such as the broader Reykjavík region. When used to circumscribe the area around specific sites of interest at a more granular scale, this method is near-guaranteed to miss relevant data that aren’t precisely geolocated. A researcher using these data would get an incomplete impression, yielding weak – and potentially misleading! – results.
To avoid these pitfalls, we suggest that your first pass over the data is as inclusive as possible, filtering down to your final dataset in your exploratory and analysis phases, rather than while doing your initial data collection from dataARC. This “top-down” approach to data mining will ensure that you do not miss potentially useful data and help you make the most of the richly interconnected nature of dataARC’s concept maps for exploratory analyses.
2: Use related and contextual concepts to find links to other datasets
Concepts are a fundamental component of dataARC’s repository structure. When anyone using the dataARC search tool requests data, the tool also returns data attached to concepts “related” to the one initially searched for, as well as data from “contextual” concepts once further removed from the search term. These results are presented regardless of whether a concept filter was initially applied, as dataARC uses the concepts contained within the selected data as the seeds for gathering the set of related and contextual (related to related) concepts and the data linked to them.
One of the primary benefits to this system of linked concepts is that it provides end users a way to expand their initial search beyond what is returned by the initial parameters chosen above. By integrating related and contextual concepts into the search results, the system mitigates the effects of the idiosyncratic ways in which individual researchers or research domains describe their data and define their own ‘key concepts’ – a process that can easily lead to missed connections.
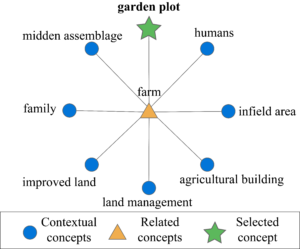
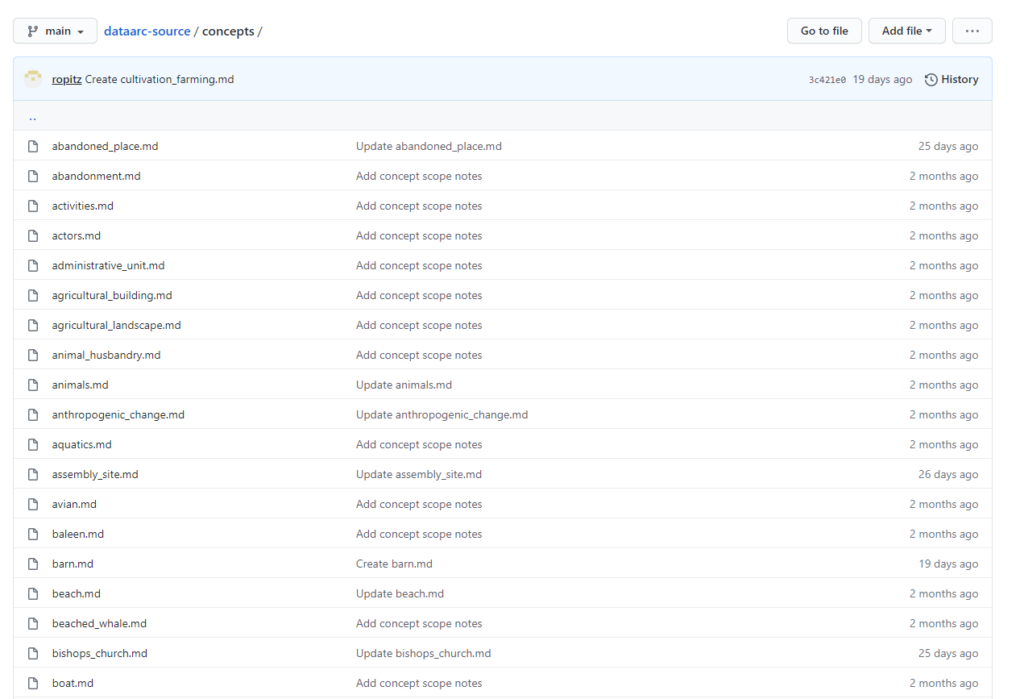
An example of how this could play out can be seen in the graph structure of the concept map above. One researcher might categorize barley seeds found in a midden as part of a “midden assemblage”, while a second might assign a similar find to the more general category of “farm“. A third researcher, interested in (e.g.) monastic gardening in medieval Iceland might start with a concept search for “garden plot“. Without the concept map’s related and contextual concepts, the monastic gardening researcher would miss both barley finds from her colleagues, significantly shrinking her power to examine her processes of interest.
To take maximal advantage of the concept mapping system, and as an extension of the first recommendation above, researchers will be best served by downloading the related and contextual datasets at the start of their exploration.
3: Keep or consistently modify dataARC’s internal data structures
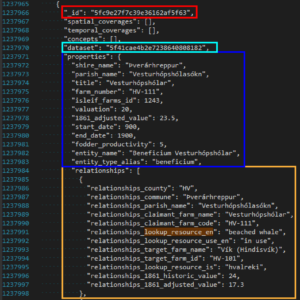
So you were careful to not overly restrict your filters, included all of the related and contextual data, and have just downloaded your first dataARC data. Opening up the .JSON file, you will note that the data are arrayed in nested groupings, some several layers deep. This data structure is the way that dataARC bundles related fields (e.g. “properties”, “relationships” etc.) together into the same feature. This organization is flexible, adding fields and levels depending on a given feature’s relevant properties, which makes it both lightweight – only keeping what’s necessary – and somewhat tricky to manage as a data input, as fields can vary between features.
To deal with this, we would recommend either (i) using analytical packages that natively handle the .JSON file format, (ii) using the arc.dataconvert function in the “DataARC Preprocessing” section of the “Climate_script” Jupyter notebook, or (iii) adopting a consistent custom scheme to capture your data of interest from the start.
For those interested in the first option, there are a number of libraries available for parsing .JSON-formatted files into python, perl, ruby, java, and – our personal favorite – R, among others. These packages will (with more or less wrangling) convert the input data into the native data structures of their respective languages – lists, arrays, scalars, dataframes, etc. – for relatively straightforward and standardizable manipulation. If you are already planning to conduct an analysis using one of these languages, it likely makes the most sense for you to use one of these to load in your data.
The arc.dataconvert function in the “Translator.R” script of the linked Jupyter notebook is another route that you might take, especially if you’re interested in obtaining .csv-formatted results instead of the more esoteric outputs offered by the JSON-parsing packages. While we wrote this R script to stage our data for the analyses in the linked notebook, it is data agnostic and will perform with any dataARC .JSON file, returning a consistent list of results for a select group of fields in a comma-delimited output (“Dataset”, “Category”, “Entry”, “Concept”, “Combinator”, “Related”, and “Context”). The main drawbacks to this method of processing are that the function will need to be run locally, which may take some time, and that the output is not directly manipulatable, needing to be fed into software and parsed and filtered further before analysis can begin (for instance, removing “:” field separators in concept fields).
Finally, you may choose to chart your own approach to manipulating these data, and that’s fine – encouraged, even! – if you think it will be more direct given your particular needs. If you do so, we would just advise you to pay close attention to the ways in which the (i) features, (ii) concepts (direct, contextual, and related), and (iii) combinators are linked within the data. Each of these structures is separated out within the .JSON output, while still referencing its links to the others in certain subfields. This is a handy way to organize the data within the dataARC repository, as it means that (e.g.) individual features don’t need to be updated when they are linked to new concepts – but it also means that these links need to be maintained as you reorganize it into your own custom data structure.
One last note: as with the fields in red and blue above, many data fields seem to contain indecipherable strings of letters and numbers. This is a data structure called a hash code – a unique reference code that is opaque to the end user, but enables computers to quickly compare, compress, and manipulate data. Each of the hash codes for features, concepts, combinators, datasets etc. are translatable to their human-readable form by using the appropriate API commands. We would strongly advise you not to do this translation until the last step unless you’re dealing with a very restricted set of data. We make this recommendation because certain features may have identical plaintext names, greatly increasing the potential for a confused analysis. These features are guaranteed to be uniquely identified by their hash code, neatly avoiding that problem. However, for fields where there isn’t a worry of duplicates – “5f41cae4b2e7238640808182” being much less readily recognized by the reader than “icelandic_farms” in the database field, for instance – it may indeed be worth it to translate.
4: Use the API(s) to fetch your data for formal analyses
DataARC’s main UI page is an excellent way to select and filter data from across the repositories datasets using powerful and responsive data visualizations. We would therefore recommend that exploratory analyses start by experimenting with the data specified through these tools in the UI, examining the newly selected data with each change to search parameters. However, once you recognize a pattern of interest in the data during an exploratory analysis, retrieving multiple datasets for analysis in a local context and specifying the exact parameters for replicability by other researchers become paramount concerns. The UI’s limited processing power and the multiple steps required to retrieve specified data through it render it a less-than-practical (though still workable) solution to these problems.
Thankfully, dataARC has provided a series of tools for quickly specifying, examining, and retrieving data while keeping the exact parameters used in the generation of a set of results. These tools, collectively known as “APIs” (Application Programming Interfaces), allow the end-user to specify the data they require from dataARC along a host of different axes, from the basic filters (e.g. only selecting data between 900 and 1100 AD) to more complex queries (e.g. all data between those dates that appear in three particular databases and have contextual concepts linked to managed landscapes) to, in extreme cases, lists of ID hashes to extract particular concepts or properties of features. These specifications can then be sent directly to dataARC’s servers with a cURL request, where – so long as the request is valid (you should see “code 200”) – the requested results are immediately returned.
The API tools are accessible using three major interfaces: the swagger API, the GraphQL API playground, and direct server requests using URL/cURL syntax in a terminal context. While the overview below is not intended to be exhaustive, a brief outline of each should illuminate their best use cases.
Note: large data requests will likely crash this interface; its primary use should therefore be restricted to retrieving small datasets and the cURL commands used to download large ones.
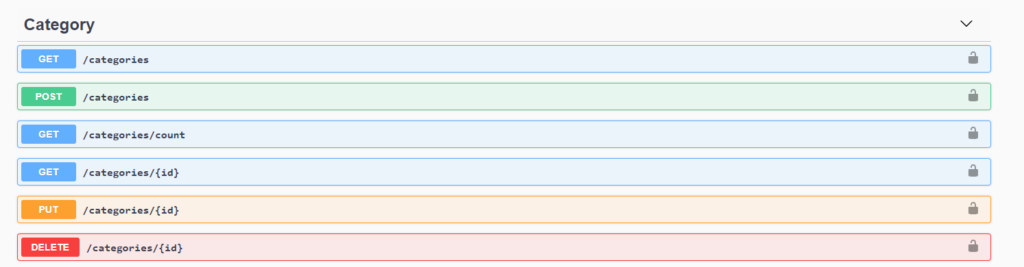
The Swagger API is an interactive interface that lists the schema for each of the major data filter types in dataARC’s repository. Clicking on each of the filter sections reveals the list of valid API commands for that filter and the full list of possible parameters for each command. More than just documentation, however, Swagger is a fully interactive API shell, allowing you to generate your own custom cURL commands that can be used to fetch relevant data based on user-set parameters. This can be accomplished by choosing the “Try it out!” button in the upper right hand corner of each section’s dropdown, inputting the desired parameters in the available fields, and pressing the “Execute” button.
Following this method will generate the valid API command as a cURL in the results section below, as well as displaying and providing the searched-for data for download in a JSON format. However, while the Swagger API is an excellent resource for understanding how to customize filtered results, it leaves something to be desired as an actual platform for downloading data, often struggling to load larger datasets. We therefore would recommend using the Swagger API mostly as a method for exploring the range of API commands available, rather than as your main portal to download data.
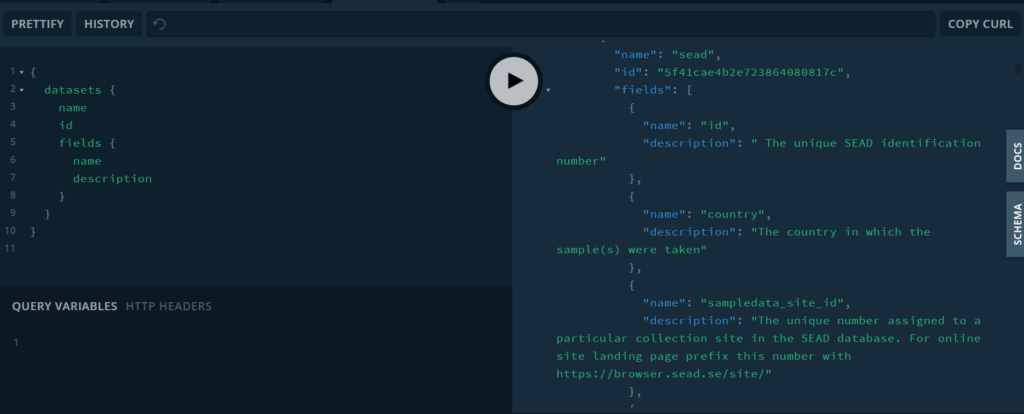
An alternative to the Swagger API, the GraphQL API playground enables you to visualize and select your data by requesting exactly the elements that you are interested in using the same nested structure seen in the data. The example shown above demonstrates a simple query (on the left) that returns the name and hash ID of each of dataARC’s datasets, as well as the names and descriptions of each field nested within those datasets, while excluding all other non-requested data. Using the interactive query window, results can be dynamically modified and examined. The “Docs” and “Schema” tabs alongside the results window provide relevant information for defining the syntax and schema for building arbitrarily complex queries. Finally, the “Copy cURL” button on the top right enables you to extract the exact API commands necessary to retrieve the displayed data from dataARC’s repository through a terminal-like interface.
While the initial use of this may not be obvious relative to the more straightforward parameterizations in the Swagger API, the GraphQL interface is the best way to retrieve and inspect particular elements within datasets. For instance, while the Swagger API allows you to retrieve datasets, specify how many results you’d like, and determine whether those results match a particular search term, the output will always include all fields within the matching database. In the GraphQL output, you can specify exactly which fields of a given set of callable entities within the API you would like to see the content of, and copy a custom cURL API call from the top bar that will retrieve only those data as a .JSON when entered in an appropriate terminal.
The third and final way of interacting with the API is through a terminal-like shell interface. This, ultimately, is what both the Swagger and GraphQL APIs are acting as wrappers for, delivering commands for you and displaying the results. These requests and retrievals are handled by the cURL protocol for transferring data with URLs, which is the function you would call when directly communicating with dataARC’s servers using the API – either natively in unix/linux/OSX distributions, or through a cURL interpreter like (e.g.) httr for R. This approach is more barebones, but is likely what you will use if you want to directly download data from dataARC into a script or to a local location on a computer for in-depth analysis.
## Example R code to import dataARC's
## categories via a cURL-like package
## (httr)
require(httr)
headers = c(
`accept` = 'application/json'
)

dataARC_categories <- httr::GET(url = 'https://api.data-arc.org/categories', httr::add_headers(.headers=headers))
Your particular use case will dictate the appropriate API choice for your data. What is important is to understand that each of these methods has its advantages, quirks, and downsides, and that they can – and should! – be used complementarily to produce, document, and promulgate repeatable data for analysis.
5: Use external data sources to supplement dataARC


The datasets in dataARC contain a host of spatial, environmental, textual and historical information, richly linked to one another through concept maps. What they do not contain are a number of other quite important – and usually open source! – resources for putting the results that you obtain through dataARC into the proper holistic context for your question. These include geospatial information for reprojection of dataARC’s planar coordinates onto a sphere, Digital Elevation Models (DEMs) for topographic relief, non-accessioned archaeological data from (e.g.) the Digital Archaeological Record (tDAR), climate projections à la WorldClim, and many others that might be directly relevant to conducting your analyses.
Thankfully, dataARC’s reliance on the consistent data structures described above makes its data very amenable to easy synthesis with outsider sources of data, to the enrichment of both. For instance, DataARC’s planar coordinates do need to be reprojected before spatial analysis, but doing so is rather trivial, and keeping the simple x-y coordinate system across the whole of the North Atlantic region makes conversion more simple than if it were already projected.
Another instance of potential for expanding on the data textual sources contained in the saga databases are preserved in their original Icelandic, which can be easily machine-translated using a public API key from (e.g.) Google translate or an equivalent service. While the quality of translations yielded by these methods is certainly not perfect, they improve nearly daily, and they can still enable some really interesting basic analyses that might have hitherto been restricted to a much smaller community of scholars – an exemplar of the type of data extensibility enabled by combining these resources.
6: Read the documentation
We understand that few people enjoy the process of getting to know a tool in all of its detail; by and large, manuals and tutorials are consulted on an as-needed basis. The reference materials for dataARC were designed around exactly such an approach, with numerous small modular help documents and prompts provided through the main user interface, Github, Swagger, and the Scope Notes, as well as on the main help page available at this link (or from the menu above).
We would encourage the new user not to be timid in directly engaging with the tools, of course – their interactivity and relative ease-of-use is a primary feature of the whole dataARC UI – but we would also note that a formal analysis should probably begin only after you have attained confidence that you understand how the data are structured – and there’s no faster way to doing that then reading the documentation. From understanding how to engage with the UI’s search tools, to expounding upon the nitty-gritty details of the API, to the best way to map your own data using combinators, to the Ecosystem Explorer tutorial, each of the components of dataARC’s infrastructure has been meticulously documented by its dedicated research team.
What if, after all of this, you still feel a little lost as to what you can do with your data? DataARC offers a veritable ocean of data, but without a roadmap for how you might integrate the various pieces into a coherent analysis, starting may seem daunting indeed. To help you figure out at least a few of the many valid approaches to exploring dataARC’s data, we developed two explanatory vignettes: Data Mining the Past and Quantifying an ever-changing landscape. Each of these showcases an analysis of a separate subset of dataARC data, explaining its utility in the context of particular research questions, running through a few sample analyses, and discussing both the potential for further, more rigorous work and pitfalls within the data. In combination with the Jupyter notebooks that contain the nuts and bolts of the statistical analysis and figure generation for these vignettes, we hope that these resources provide you with a few leads to jumpstart your own process.
7: Contribute to dataARC!
If you’ve gotten this far into a page dedicated to the best ways to manipulate the data available through dataARC, let’s face it: you probably know more about the North Atlantic than your modal passerby. Whether this means that you have already have access to data that you yourself have generated or are just starting along the path to doing so, you therefore have the opportunity to not only be a passive consumer of dataARC’s data, but an active member of its community by contributing your dataset.
Though a somewhat complex and undeniably time-consuming affair (extensively documented in this tutorial), uploading fresh data and expanding the project’s concept maps is the single most important way that you can give back to dataARC’s community of North Atlantic scholarship. The platform’s concept maps and database structure has been designed to be arbitrarily extensible, and we are actively seeking collaborating researchers and institutions interested in integrating their data and connecting it to other sources of information about the North Atlantic world.
The resources available across all of dataARC are intended to be comprehensive when it comes to defining data organization, filtering, and retrieval systems, while being open-ended as to your use of them. If you feel like there are missing components that you have an insight into adding, or would like to build out your own combinators (or even vignettes!), we would strongly encourage that too! Our team is reachable through the contact page above, or by posting an issue to the various github repositories that host the components of dataARC.
Research communities are strongly dependent on good infrastructure to produce high-quality, replicable, public-facing, and socially-relevant studies. However, infrastructure is in turn something that must be tended to, maintained, and extended by its community if it is to become more than a static resource. DataARC is committed to making its tools available on an open platform, and its design team and current data contributors have accomplished a tremendous feat in developing, testing, and documenting the entire suite of features and provisioning its initial 15 datasets. With your help, and the support of the broader North Atlantic community, dataARC can continue to build on this research momentum, shedding ever-more light on the complex interactions that define humanity’s relationship with this diverse region of the world.