Synthesis


The dataARC tool is designed to enable research that combines data from disparate specializations, and does so in a way that is accessible to non-specialists. The structure of the dataARC Ecosystem makes this possible: the team behind dataARC have worked hard to link data temporally, spatially, and conceptually so researchers can explore previously unimagined dynamics. Reconciling differences in how researchers from different disciplinary backgrounds reference time and location (space) was a necessary part of the dataARC team’s work. Investing in comprehensive research infrastructure provides the opportunity to link collaborators and, resulting in the opportunity for a holistic approach to understanding the rapid social and environmental changes that occurred in the past and for the creation of digital tools for expanded capacity to engage other users, including students and Indigenous northern communities.
The project team has developed a shared data model and conceptual framework to build links between different disciplines. Groups of scholars worked together to develop documents describing each concept as defined in the search tool (scope notes), including connecting each concept to items you can search for in the dataARC system, according to the combined expertise of the group members.

The purpose of the concept maps, scope notes, and data-to-concept mappings (referred to within the project as combinators) is to provide improved access to and understanding of these diverse, specialized datasets to students, researchers, and anyone interested in the human ecodynamics of the North Atlantic. The tool is designed to encourage users to consider the relevance of data from multiple domains to their research questions, particularly at the early data discovery phase of a project.
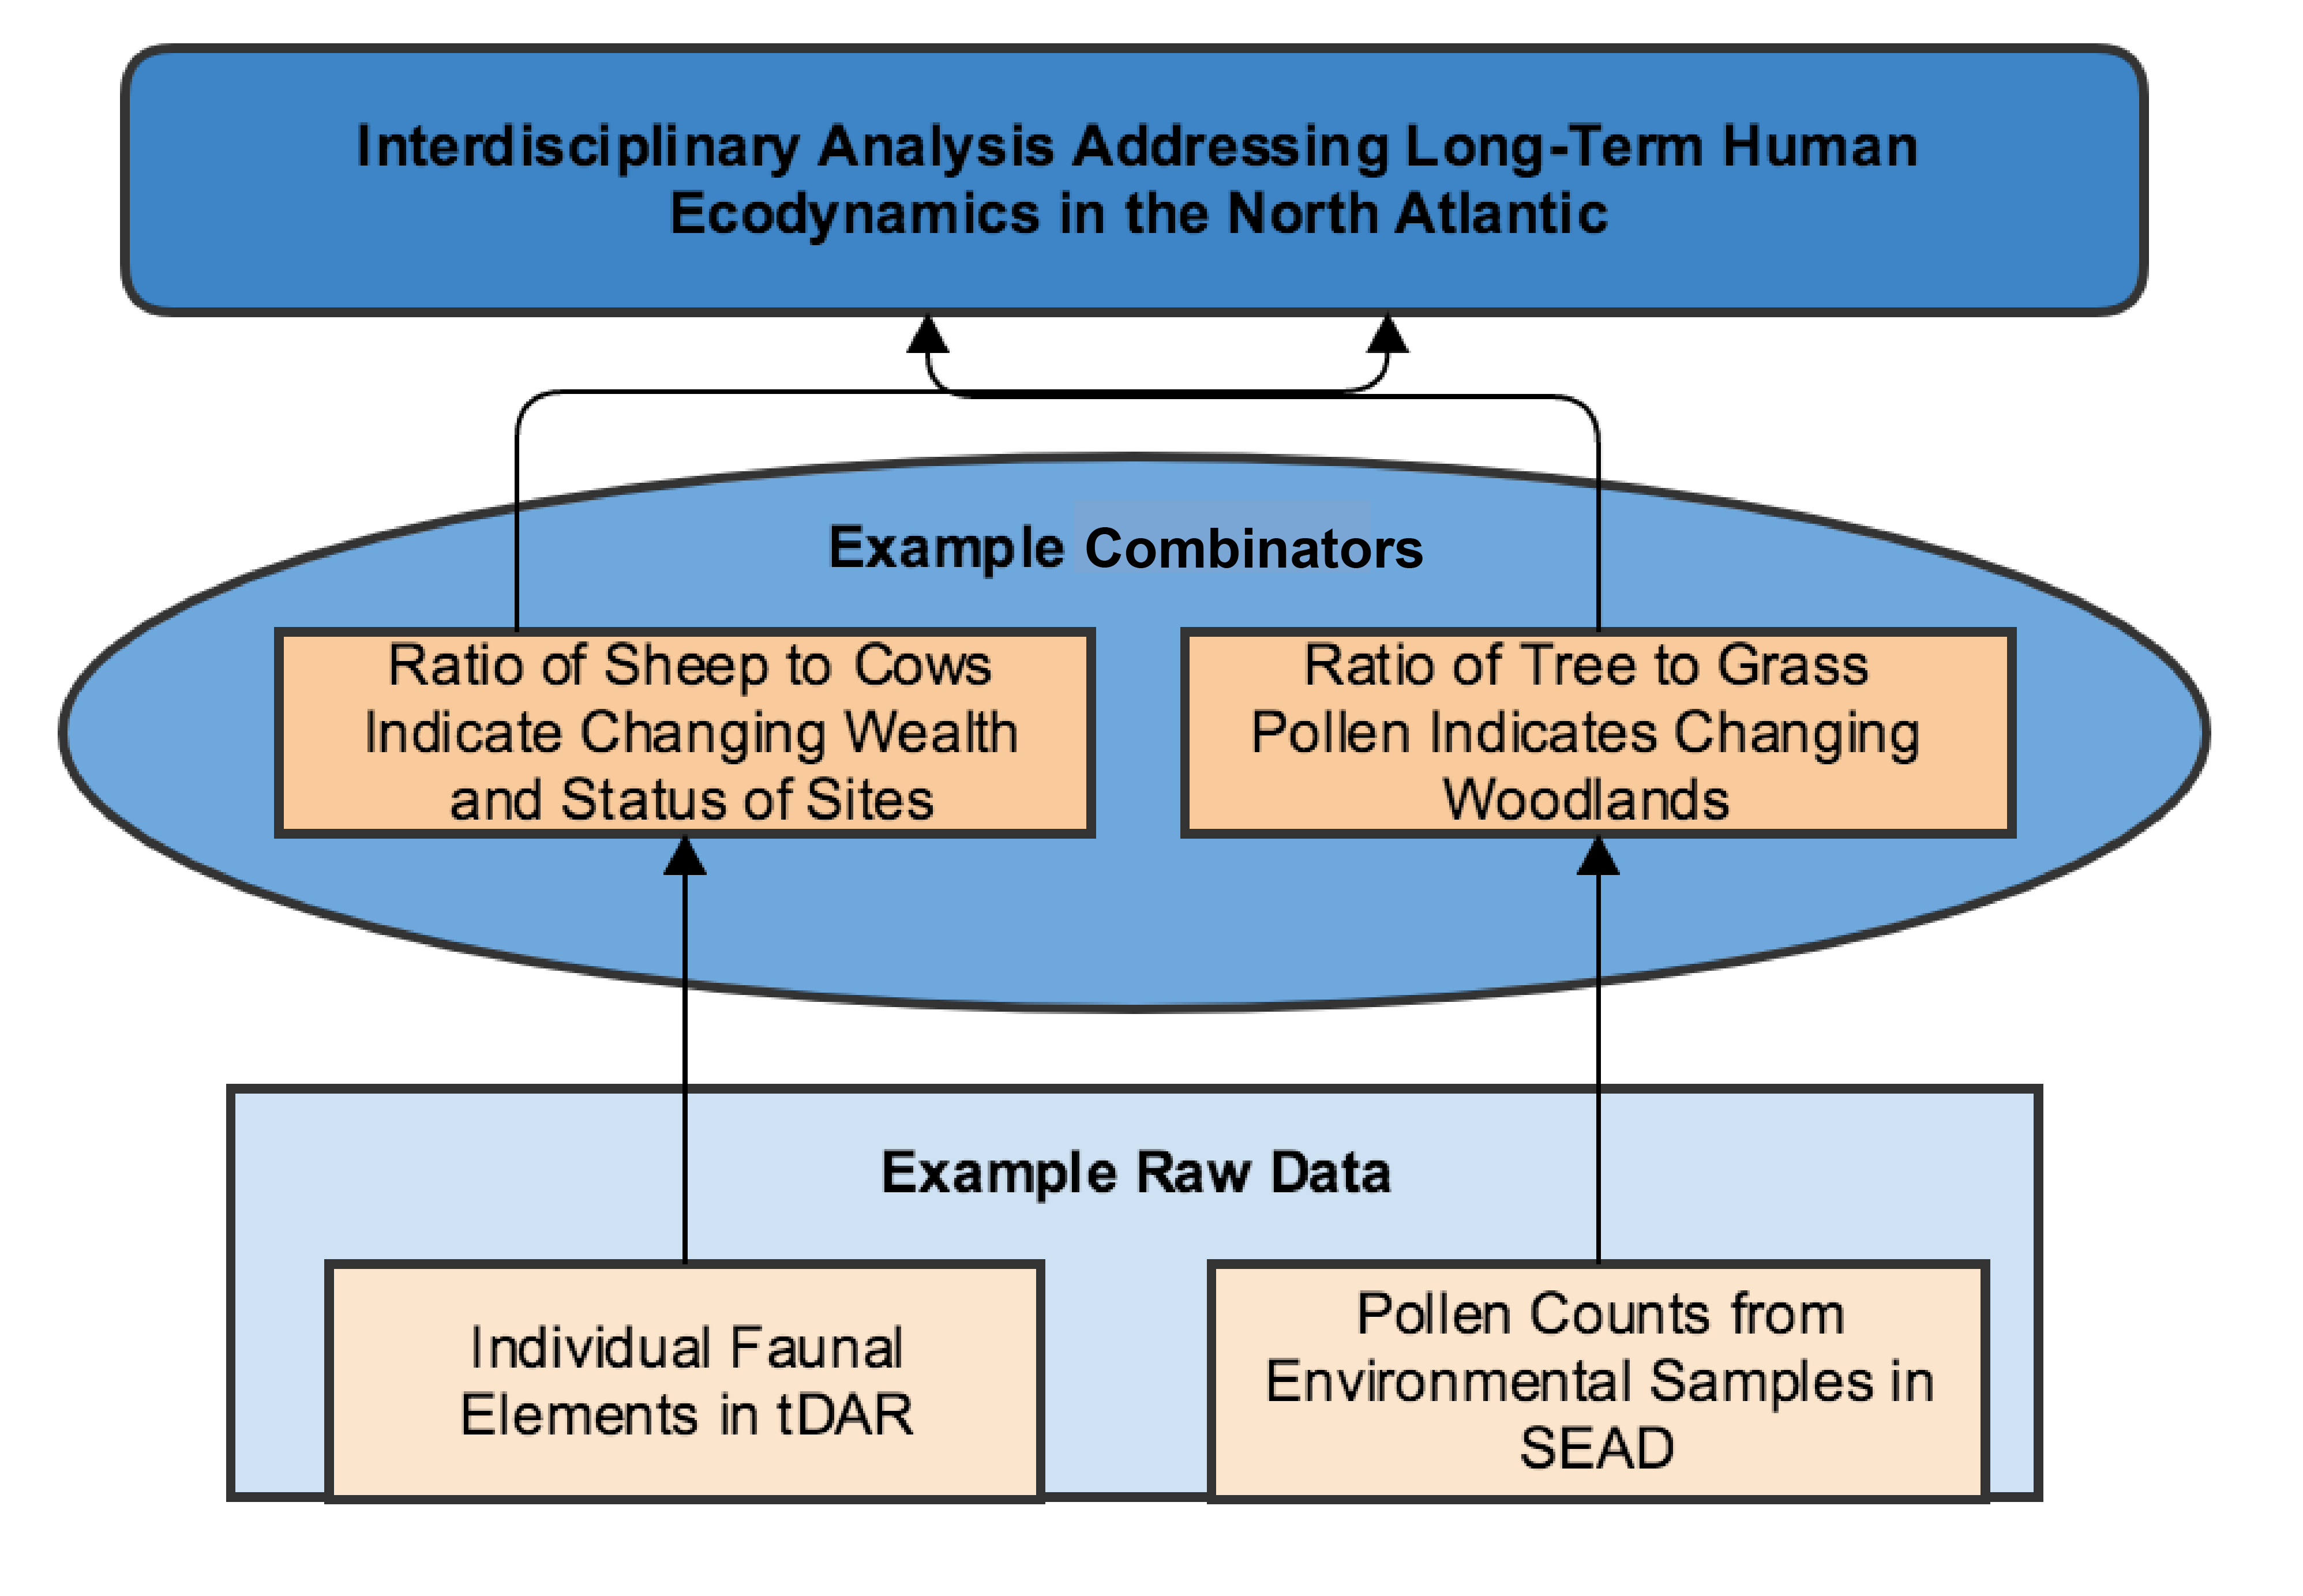
For example, a researcher that specializes in pollen analysis who begins to explore the data related to concepts of land management and outfield areas in Iceland through the dataARC tool would find data from SEAD connected through the tool, and would also be presented with data from NABONOSEAD and combinators which highlight the implications of faunal data found at archaeological sites across the North Atlantic for the concepts they used in their search. Analyzing and interpreting ‘raw’ faunal data (or any other domain’s basic data) requires training and therefore this ‘raw’ data may not be most suitable or accessible to someone looking to make an initial foray into a new area of interdisciplinary work. For this reason, the dataARC team focused on making data accessible at a more synthesized level, as seen in the middle of the figure to the left, through what we call 'combinators'. These are meaningful combinations of data developed or used by domain specialists which they consider to be more interpretable (with some caution!) by non-specialists. While the raw data are still archived and accessible at partnered repositories, for example, SEAD or Tephrabase, dataARC will provide results at the combinator level, allowing for researchers to access data that can more easily contribute to interdisciplinary synthesis research. Read more about how the project team has developed combinators and the associated dataARC concept map on the Concepts page.