Data mining the past
Using dataARC to leverage statistical information from a range of different historical documents simultaneously
Andrés G. Mejía Ramón and Richard Bankoff
For an in-depth explanation of the data & methods used to generate the analyses described below, see the “History_script” Jupyter notebook here. Note: the linked binder may take some time to load on slower systems.
Written histories come in many forms. Some can be taken as faithful representations of the past—documenting people’s lives, livelihoods and professions for purposes such as taxation and recordkeeping. Others incorporate myth and lore with accounts of historical people and events, giving us insights into past communities’ senses of identity and belonging. Researchers studying the past can make use of these different types of documents, reckoning with the different types of information they provide. Data mining dataARC provides a powerful way of combining evidence and bringing to light new insights from old texts.
The Sagas and the Jarðabók
The Sagas of the Icelanders (Íslendingasögur) are collection of prose narratives written during the thirteenth through fourteenth centuries about the founding and early settling of Iceland from the late ninth to eleventh centuries. They name several thousand places whose locations are mapped in the Icelandic Saga Map Project, led by Emily Lethbridge (Lethbridge et al. 2021). While narratives like the sagas provide vivid depictions of the past, they do not easily lend themselves to providing standardized information for regional-level quantitative analyses.
In contrast, cadastral records such as the early 18th-century Jarðabók by Árni Magnússon and Páll Vídalín contain detailed information about people’s position in their local community, the productivity of their land and its location, while others such as the Ný jarðabók fyrir Ísland (also called the Jarðabók Johnsens after its author) contain information about its valuation (Pálsson 2016). It may not be exciting reading for everyone, but its standardized data makes it ideal for large-scale analyses using statistical methods. Combining these two data sources – sagas and Jarðabók information — can help us to develop a sense of the value ascribed to different parts of the landscape in multiple ways, taking into account both economic and cultural value associated with different locales
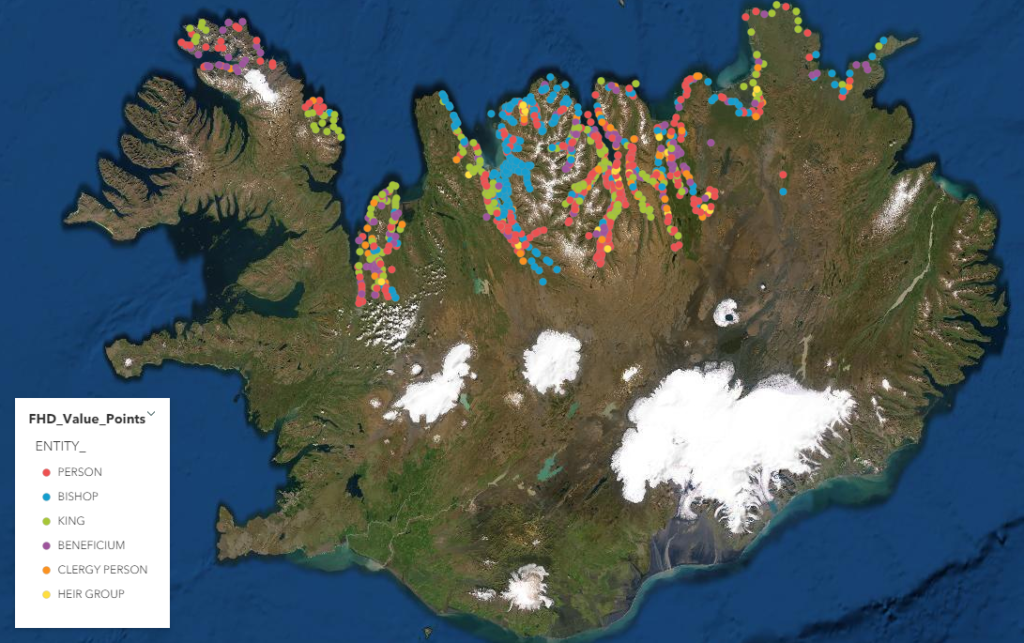
To investigate the way in which different parts of the land were valued and to better understand what factors increased or decreased its value, we begin by looking at descriptions of their economic value in the Jarðabók. While the Jarðabók contains some information for sites throughout the inhabited parts of the island, only the north coast has entries in dataARC for the four variables we’ll consider–the land’s fodder productivity, its valuation in 1861, its owner, and access it may have to other types of resources. Although our observations are limited to only around one-third of the total number of locations listed in the Jarðabók we can still draw some preliminary conclusions from plotting the distribution of owner types. Landholdings belonging to individual ‘persons’ or those held by the king are scattered throughout the northern coasts, with limited visual evidence for clusters or gaps in the pattern. Bishops’ possessions are concentrated largely around the Skagafjörður valley in north-central Iceland.
Maps are useful ways of visualizing how data are distributed across space, but sometimes relationships exist that aren’t readily apparent on a map. With a small number of variables, visual comparisons between patterns can be made with relative ease. By the shape and color of the scattered points, we can visually differentiate up to four variables without difficulty. For example, let’s take a look at the relationship between a landholding’s value, its fodder productivity, its owner, and access to other types of resources (although sites without immediate access to the resources may be able to procure them through different distribution networks):
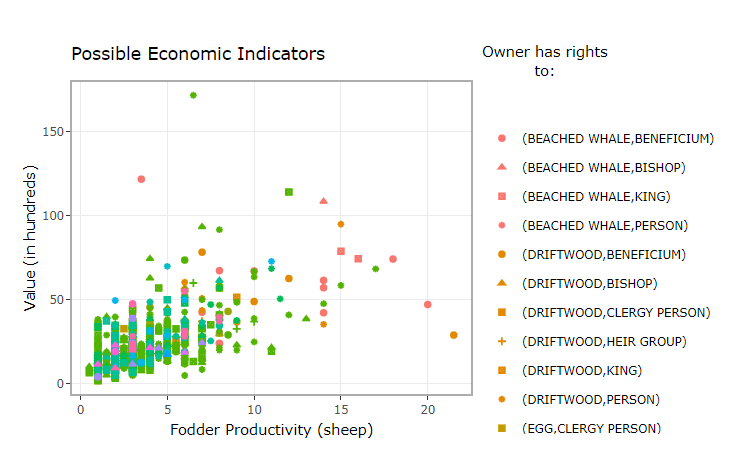
We can see that the amount of fodder that can be produced is a major component of how land was valued in the 1861 Jarðabók Johnsens. Generally, as the land is more productive, its value increases. But within that obvious linear trend, there’s a lot of room for uncertainty. Other variables may account for this error. A few qualitative variables seem to relate to this relationship as well–most of the sites with immediate to beached whales and driftwood look as if they are worth more and have higher fodder productivities–but the trends aren’t as clear. More sophisticated methods are needed to see what is going on.
Dimensionality Reduction
One commonly-applied statistical approach is Dimensionality Reduction. Dimensionality reduction is a family of statistical methods that allow us to take many variables and summarize them in a smaller number of “principal dimensions”. For example, the two numerical economic variables plotted above (productivity and valuation) can be summarized by fitting a line that represents a good compromise between the value of each variable at each point. In that case, two “dimensions” (again, productivity and value) are “reduced” to a single one—the “best fit” line, possibly tied to economic wellbeing.
Principal components analysis (PCA) is one of the most common methods of dimensionality reduction, but it’s only appropriate for purely quantitative variables. Two of our variables–owner and resource access–are qualitative. Unlike productivity and value which are numeric and tell you how much of something, owner and resource types involves membership in classes that can’t always be described by ranges of numbers. Factor Analysis of Mixed Data (FAMD) can do this for more than two variables–including both qualitative and quantitative (Pagés 2004). The FAMD output dimensions can be interpreted in a similar manner as those for PCA, with the first dimension capturing the major trends and most of the variability in the data and each subsequent dimension capturing less and less of the variability of the original data.
The 3D scatterplot above plots the data again, but this time in Principal Dimension space and not in its original coordinates. (A 3D scatter plot wouldn’t be possible in the original coordinates, since we only had two numerical variables!). Watch as the plot rotates such that you are looking head-on at the XY plane (looking down Dimension 3). The FAMD has arranged the observations into neat little columns that correspond with combinations of the qualitative variables, with most of the inter-group variability concentrated along Principal Dimension 1. The between-group variability seems to be best described by Principal Dimensions 2 and 3, suggesting that those are largely controlled by the qualitative variables. This shows us along which dimensions the variability is aligned, but it doesn’t tell us much about what the axes mean to begin with. For this, we can look at FAMD circle and class centroid plots.
Using FAMD circle plots to assess the relationship to assess the relationships between quantitative economic variables
For quantitative variables, dimensionality reduction can be thought of as rotating the data in “variable space”. For example, in the 2D scatterplot example, to get the first principal dimension you’d rotate the data until the x-axis is aligned with the best fit line between productivity and valuation.
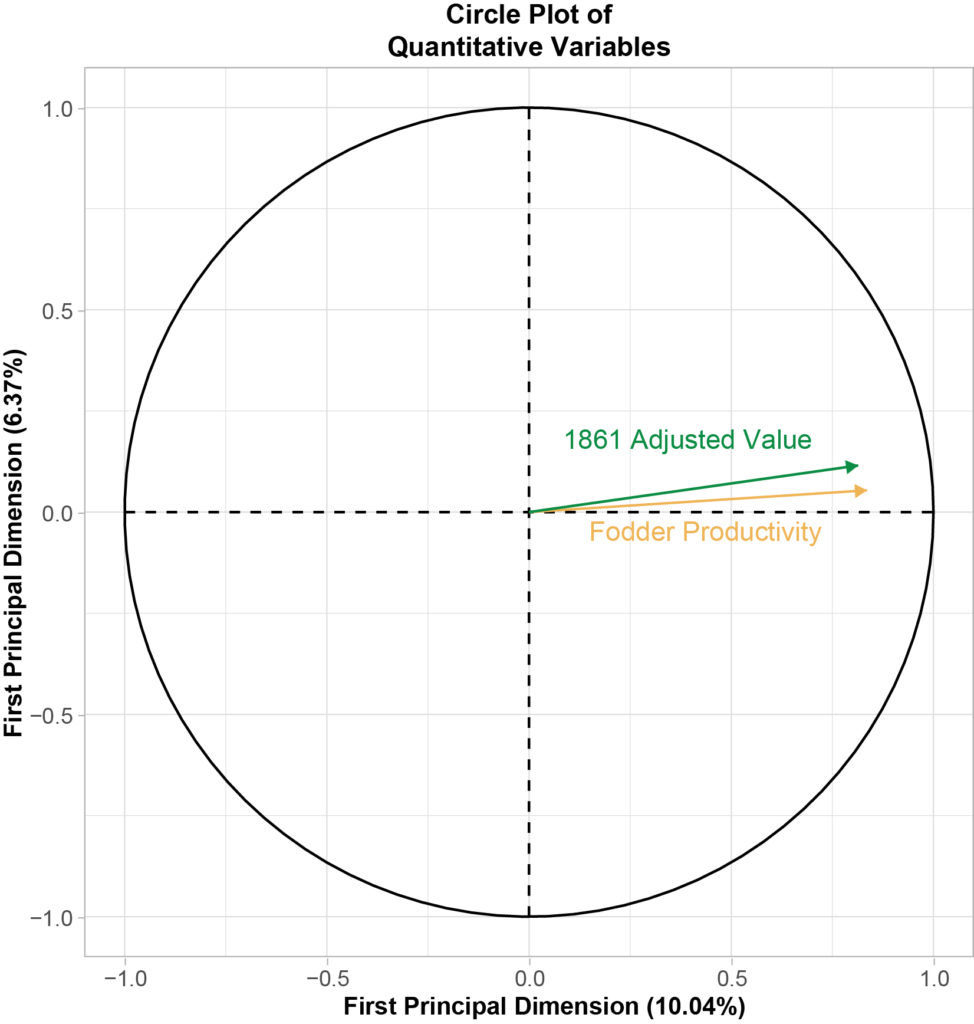
The circle plot shows by how much you have to rotate the data to match the first two principal components with the two numeric variables. The y-axis is the first principal component—the output variable that did the best job of summarizing the dataset—while the y-axis is the second. We can see that the two variables are very close to the x-axis, with a very small angle between the three.
With FAMD, we expect the trend lines created by plotting more-closely-related quantitative variables to point in similar directions. The smaller the angle between them, the closer their relationship. The circle plot shown here reinforces what we saw in the scatter plot above. The productivity and value variables vary in the same direction (when one increases, so does the other)–while the small angle between them shows that it’s a pretty strong fit. This suggests that when we look at each individual observation, its first principal dimension score will be a pretty good proxy for how economically well-off a landholding was.
Using FAMD scatter plots to to evaluate qualitative variables
The scatter plot below shows the qualitative variables’s “mean score” along each axis. Recall that each axis represents one of the first three principal dimensions. This is like looking down the third principal dimension in the 3D scatter plot, “flattening” it so that we only see the projections of each group’s centroid onto the x-y plane.
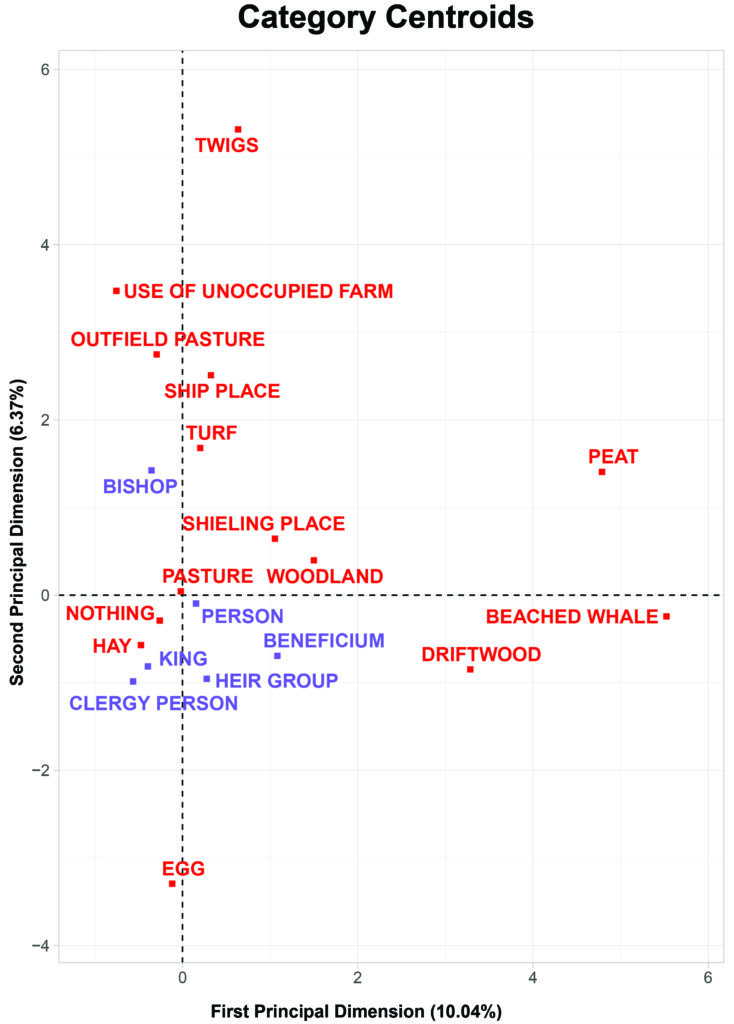
Based on our assessment of the quantitative variables, we will assume that the first principal dimension is a measure of economic wellbeing. Looking at the mean scores of the qualitative variables along this first principal dimension, we can see several notable trends. Landholdings with access to beached whales, driftwood, and peat are on average more closely-associated with more well-off parcels—they’re farther to the right on the x-axis. This is consistent with knowledge from the historical record. Beached whales and peat provided valuable sources of fuel to the premodern Icelandic economy, and were heterogeneously or sparsely-enough distributed that not all landholdings had access to them (Pálsson 2016).
The resource types close to the y-axis don’t encapsulate economic well-being as much. The ownership classes also don’t do a very good job of describing economic variability, but between those groups there is a small degree of differences. Whereas land held by churches in beneficia was generally better-than-average, land held by the clergy or the crown was generally slightly worse-than-average. This is also consistent with the historic record, given that lands held by those two owner types was generally worked by landless peasants without access to lands held in other types of ownership.
Interpreting the second dimension is a little more complicated. The circle plot suggests that as values increase in the second dimension, generally so do the values for valuation and productivity–but not so much as in the first dimension. The plot of categorical centroids suggests that this dimension is largely defined by variability between the qualitative variables, but a clear or intuitive order isn’t immediately evident. To investigate this second dimension further, we will integrate the concepts to which these different datasets are mapped within dataARC. This will let us leverage known information from the Jarðabók to explore textual data from the Sagas.
Concepts for Linking Data
DataARC’s infrastructure currently connects together 15 different datasets related to life in the North Atlantic region, containing data types from geolocated artifacts and ecofacts, to 19th-century land survey data, to records of the volcanic ashfalls (tephra) that enable researchers to establish absolute chronologies for sites. DataARC’s infrastructure design focuses on the use of a “Concept Map” to knit together data from different sources that might nevertheless relate to the same central concept that a researcher is interested in, going beyond basic data aggregation and indexing.
The project’s concept map is built around the central theme of the ‘changing landscape’. The linked concept notes explain how concepts are understood by members of the research community. Using a graph structure, it links together related concepts, for example explicitly connecting the ‘built environment’ to the ‘church’ to ‘ecclesiastical power’ to ‘resources’ to ‘driftwood’. It was developed collaboratively through meetings and workshops over the course of three years, in which the set of key concepts needed to describe the group’s shared research domain were debated and refined.
Individual data contributors map subsets of their data to the specific concepts for which that data is most relevant. While data contributors working in different domains are likely to map their data to different concepts, the connections built into the concept map provide a way to connect their data together (Pálsson & Opitz, 2019). When anyone using the dataARC search tool requests data related to a specific concept, the tool also returns data mapped to concepts related to the one that was searched for, as well as concepts related to those linked concepts. The integration of related and contextual (related to related) concepts into the search results enables the system to mitigate the effects of the idiosyncratic ways in which individual researchers or research domains describe their data and define their own ‘key concepts’.
Very few datasets have fields or variables in common with other datasets. However, in general most datasets share concepts with others, allowing researchers to identify potential patterns across data sources even when the data themselves may not be directly comparable. To date, a total of 280 concepts ranging from fish to humans, ecclesiastical power to luck, and animal husbandry to dung have been mapped to many of the observations in the datasets contributed to the project.
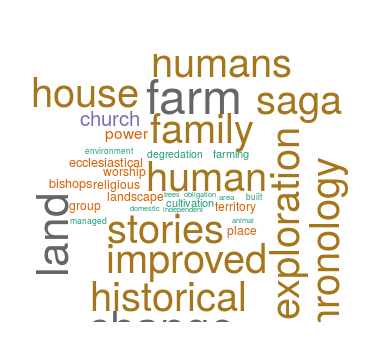
Jarðabók 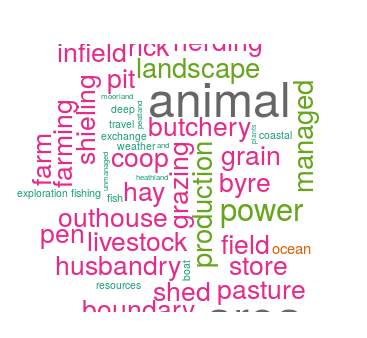
Sagas
Teaching Machines Cultural and Environmental Concepts
Through the use of dataARC’s concepts, we can leverage the information contained in one dataset to explore another one, enriching our understanding of the resources which are available in different parts of the landscape discussed in the sagas. The Jarðabók Farm Histories Database contains information about resource access, telling us what resources were provisioned to the broader region from that location. The Icelandic Saga Map data describes other meaningful locations in the landscape, but generally does not comment explicitly on the resources present at or absent from them. To extrapolate the information on available resources in the Jarðabók to locations described in the Sagas, we can use the concepts shared by the two data sets as a bridge. First, we train a classifier to predict resources listed in the Jarðabók using concepts mapped to those sites. We then use the concepts tied to the Icelandic Saga Map sites and the classifier to try to predict whether a location may have had such available resources based on the situation at conceptually similar sites in the Jarðabók. Since some of the listed resources have very few observations, we reassigned the resources into one of for general resource categories— “Pasture,” “Marine,” “Terrestrial Materials,” and “Other”.
We have to be careful though. The concepts are nominal data—they don’t really represent numbers, but numbers are what classifiers typically expect. We have to be sure our classifier is robust against different types of sampling strategy and uncertainty, and that it doesn’t make assumptions that pretend to know more about the data than we actually do. One possible approach for accomplishing this is the use of decision trees.
Decision trees “decide” how to classify data using a series of if-then statements. For the historical textual data, it would check if a series of concepts applies, and then classify it based on the most common resource in the final groups at the end of the input Jarðabók decision tree. By itself this is a fairly poor method, but when used as a large group of trees that “votes” on the final answer they form a powerful and simple machine learning approach known as random forests. Random forests are a popular tool in machine learning because they are robust, make very few assumptions about the data, and are good at ignoring unimportant variables (Breiman 2001). This makes them a good fit for our application, where we have many concepts involved.
Before we can try to predict new information, we need to see how good the machine-trained random forest model fares. If the model fails to accurately predict information that we already have, we should not trust any of its predictions for data that we don’t yet know. We can’t go back in time to conduct a census of farms during the times of the Sagas to verify the predictions, but we can exclude a small portion (10%) of the Jarðabók data from the training dataset. If we run the excluded 10% from the model trained on the other 90% and it predicts resource availability poorly, then we know it should be rejected.
With the exception of the “Other” category (which includes landholdings with access to eggs, tolls, bird hunts, and lamb rearing), the random forest classifier worked remarkably well in predicting the four resource categories we defined using the dataARC concepts. Landholdings with access to pasture-related resources were correctly classified in 90% of the circumstances and marine-related resources 76% of the time. Even terrestrial materials at 56% is more than twice what would be expected purely due to chance. Consistently between one-fifth to one-fourth of the resource categories were incorrectly classified as Pasture, suggesting that this particular random forest is prone to a high number of false-positives in that category but few false-negatives. In other words, just because something is classified in the Pasture category doesn’t mean it was correctly classified as Pasture. However, if something is not classified as belonging in the Pasture category, it most likely is correctly omitted from that category. Most Pasture sites were classified as Pasture correctly—but a lot of other sites were also classified as Pasture incorrectly. Having trained and evaluated the classifier, it was then used to predict resource categories associated with locations identified in the Icelandic Saga Map data.
Right: Predicted resource categories for the Saga sites. Each circle’s size corresponds with the percent certainty
On the left are each of the Jarðabók sites with the known information. On the right are the saga sites, with the corresponding predicted resource categories. We can interpret the “predicted category” as seeing how much researchers describe particular saga sites in a similar manner to Jarðabók sites with known data about subsistence economics. The circle’s size corresponds with the model’s percent certainty that a site with a given combination of concepts should belong in a particular class. The more certain the model is, the more similar dataARC’s conceptual descriptions are.
In short, larger circles represent saga sites that were described in a really similar manner as particular types of Jarðabók sites. Small circles represent sites that are described in manners that are completely dissimilar to these particular types of Jarðabók sites. The entirety of the remainder are most similar to pastoral Jarðabók mentions, but in probabilities ranging from 26-49%. This implies that in the best of circumstances, the prediction is more likely to be wrong than right—and therefore the conceptual descriptions really are not too similar.
Conspicuously absent are any sites that are predicted to have access to resources that correspond to the “Terrestrial Material” or “Other” resource categories. This does not mean that they were entirely absent during the initial colonization of Iceland. Rather, it points to a likely source of bias. For example, the Jarðabók and the sagas are entirely different types of historical sources—one a cadastral record and one a series of narratives—each containing different types of information. Furthermore, the nature of the sagas makes them difficult to encode, and as a result the particular information that was encoded into dataARC may simply lack information about or be unable to describe those resource types. This may also point to a potential bias in the way concepts were mapped to particular data. The “why?” section of dataARC’s search tool user interface’s “Combinator details” section contains a description of such potential issues with data. For example, the combinator “Potential insect evidence for dung” reads “Potential insect evidence for dung, but some species could be attracted to environments which are similar to dung (foul stuff).” Conservative mapping of different datasets may lead to limited variability in the total number of combinations of each concept. This would overfit any predictive algorithm if the original number of observations for a particular category is small, making it hard for the model to deal with data that looks different from the training set.
What the model does know is that a fairly large number of saga sites—particularly in the west—are described near-identically in terms of concepts as Jarðabók farms with availability of pastures and pastoral-related resources. A smaller number of sites are very similar but not a complete match to Jarðabók farms with access to marine-related resources including shipping, driftwood, algae, seals, and beached whales.
What can we conclude on the basis of this analysis? We know what that means for the Jarðabók sites from our dimensionality analyses above. Sites with access to certain types of marine resource such as “driftwood” and “beached whales” tend to be more economically well-off and have higher potential for fodder production. But what does it mean for the sagas? Are the concepts being necessarily mapped in the same way focused on the economic systems around environmental strategies? Let’s explore a few of these sites and read a translated excerpt from the saga chapter where they were originally referenced.
Prediction: Marine (67%)
Referenced in Egil’s Saga, Chapter 29:
“Skallagrim was a good shipwright, and westwards of Myrar was no lack of driftwood. He had buildings set up on Swan-ness, and had another house there. This he made a starting-point for sea-fishing, seal-hunting, and egg-gathering; in all these kinds there was plenty of provisions to get, as well as driftwood to bring to him. Whales also often came in there, and whoso would might shoot them. All such creatures were then tame on the hunting-ground, as they were unused to man. His third house he had on the sea in Western Myrar. This was even a better place to look out for driftwood. There, too, he had land sown, and called it Acres. Over against it lay islands, among which whales were found; these they called Whale-islands.”
Prediction: Marine (67%)
Referenced in Fljótsdæla saga, Chapter 7:
“That town is called Eyvindará, it is east of Lagarfljót, and is one of the most rocky lands in the district and a lot of beautiful land.’ Then it happened that the sisters bought this land and Grói put an estate there together and Droplaug gave her food and other things she needed for the estate. Gróa has her ship cut up and transported home with the wood and put in a house and the wood is still in the house. Gróa soon showed great growth and became very popular. She was the smallest of women but exceptionally good-looking, in a good mood and a great and curious diver.”
Prediction: Pasture (100%)
Referenced in Bárðar saga snæfellsáss, Chapter 3:
“Then it occurred to him that a land-wind was better than a
sea-wind, so he thought the lands south of the moor would be better. He sent his son south during Gói, and they found horsetails then and other growth. While one went back, the other remained behind. Bárðr then made a jaw-bone sledge for each living creature able to walk and he had each drag its fodder and harness. He travelled to Vonarskarð, a
pass on Hope Mountain. It is now called Bárðrs Road or Bárðargata. He took possession after that of Fljótshverfi or Fleet’s Farms, and remained at Gnúpar, Peak, and that spot was called thence by Gnúpa-Bárður.”

Our first read suggests that the saga sites classified as “Pasture” with near-certainty do closely resemble what we think of as pastoral sites in terms of the Jarðabók. There’s a description of the quality of the land, and evidence of its use for hay and the rearing of animals. Sites classified as similar, but not identical to “Marine” vary in how the conceptual connection could be made. The passage from the saga for the first site transmits a very similar idea of a marine-oriented economy as the Jarðabók. Whales are exploited, as are driftwood and ample seal populations. The model may have conservatively assigned it a 67% certainty due to differences in the way it was mapped to concepts if a number of pastoral-associated concepts were also entered. Alternatively, it may lack particular concepts that a Jarðabók “marine” class would otherwise be expected to have.
The second marine site we read about is quite different. The saga does not describe a marine-based economy, but does describe the marine-based origins of a particular family and farmstead. Indeed, a number of other saga “marine” sites lack descriptions of the land and instead contain large numbers of references to ships—particularly in voyages to Norway and Iceland. Does that mean they’re not related? Not necessarily. Remember, the percent certainty really just means how similar they are to a particular class, so there’s not really a right or wrong answer. Rather, it depends on what your question is. If you’re an archaeologist interested in excavating a number of sites to understand how marine-heavy economies functioned in early Iceland, the model would give you a lot of sites that are conceptually related to the sea, but likely don’t have many relevant material remains available for excavation and study. In this situation, the random forest model probably wouldn’t be worth it. If you’re an economic historian interested in the formation of sociopolitical and economic networks originating from oceanic activity, then the model would be quite helpful.
Conclusion
Research on human environment relationships in the past relies on a plethora of different methodologies, datasets, and research questions. Tools such as dataARC can provide convenient access to large amounts of data from an individual dataset to explore particular trends, as illustrated in the dimensionality reduction analysis of potential economic variables. More importantly, dataARC connects observations and datasets through matching, related, and contextual concepts. This is what allowed us to compare how the landscape and economic activities within it were characterized based on quite different texts, whose compositions were separated by over half a millennium.
In carrying out this kind of analysis, we must be careful and make sure that every decision is guided by reasonable assumptions. Good exploratory data analysis requires informed trial, error, repeated adjustment, and attention to the assumptions made. In the examples above, we compared the outputs of the model of with other sources of information, questioned whether it made sense, and qualified all of the (weak) conclusions we drew from the analyses. From the dimensionality reduction analyses we know that fodder productivity, and access to peat, driftwood, and beached whales are closely related to each other and likely to economic wellbeing. From the machine learning approach, we know what Saga sites have been described in similar terms to farms engaging in particular forms of economic and subsistence behaviour in the Jarðabók.
DataARC provides both the raw data from specialists across the region, and the tools to leverage information from one dataset to explore another. It allows researchers to draw conceptual connections across methods and projects, allowing them to discover information from historical, environmental, and archaeological sources that may serve useful depending on the particular research interest. This is the first step towards truly transdisciplinary analyses, allowing researchers to understand the implications of their research across different topics. DataARC has the potential to vastly improve our ability to understand the connections between various sources of evidence, and to weave them together into coherent and multi-faceted reconstructions of life in the pre-modern Norse world.
Bibliography
- Breiman, Leo. (2001). Random forests. Machine Learning, 45:5–32.
- Bárðar saga snæfellsáss. (ca. 1300). Electronic Resource accessed through the Icelandic Saga Database, https://sagadb.org/bardar_saga_snaefellsass.is/. Accessed 8 February 2021. Translated from Icelandic to English with Google Translate.
- Egil’s Saga. (ca. 1240). Electronic Resource accessed through the Icelandic Saga Database, https://sagadb.org/egils_saga.en/. Accessed 8 February, 2021. Translated from Icelandic to English by W.C. Green, [1893].
- Fljótsdæla saga (ca. 1400). Electronic resource accessed through the Icelandic Saga Database, https://sagadb.org/fljotsdaela_saga.is/. Accessed 8 February 2021. Translated from Icelandic to English with Google Translate.
- Lethbridge, Emily, Hjördís Erna Sigurðardóttir, Gísli Pálsson, Zachary Melton, Trausti Dagsson, and Logi Ragnarsson. (2021). The Icelandic Saga Map. Electronic Resource, http://sagamap.hi.is/. Accessed 8 February, 2021.
- National and University Library of Iceland. (2021). Digital Facsimile of Landnámabók og Kristnisaga [1302-1310], p. 14. Electronic Resource, https://handrit.is/en/manuscript/imaging/is/AM04-0371/. Accessed 8 February, 2021.
- Pálsson, Gísli. (2018). Storied Lines: Network Perspectives on Land Use in Early Modern Iceland. Norwegian Archaeological Review, 51(1-2): 112-141.
- Pálsson, Gísli, and Rachel Opitz. (2019). DataArc: a case study using CIDOC CRM as an ontology for transdisciplinary research. In The ARIADNE Impact, edited by Julian Richards and Franco Niccolucci, pp. 135–150. Archaeolingua Foundation, Budapest.
- Pagès, Jérôme. (2002). Analyse factorielle de données mixtes. Revue de Statistique appliquée, 52(4): 93–111.