Quantifying an ever-changing landscape
How dataARC’s tools for data synthesis can improve our understanding of the North Atlantic’s dynamic past, present, and future.
Richard J. Bankoff & Andrés G. Mejía Ramón
For an in-depth explanation of the data & methods used to generate the analyses described below, see the “Climate_script” Jupyter notebook here. Note: the linked binder may take some time to load on slower systems.
The North Atlantic biocultural region encompasses a vast area on the northern fringes of the European continent. From the mid-sixth to the mid-fourteenth century AD, North Germanic-speaking peoples living on the margins of the North Sea surged outward in waves of migration, reaching every corner of the region. Landing in Iceland sometime after 871-2 AD, and arriving on Greenland’s desolate shores around 985 AD at the peak of the Medieval Warm Period, Norse people engaged in the struggle of settlement (Sigurgeirsson et al., 2013; Barlow et al., 1997). Landnám, (lit. “land-taking”), as it became known in the newly-settled region, required ingenuity, lifetimes of traditional ecological knowledge, and extraordinary communal willpower to persist in one of the least hospitable biomes on the planet.
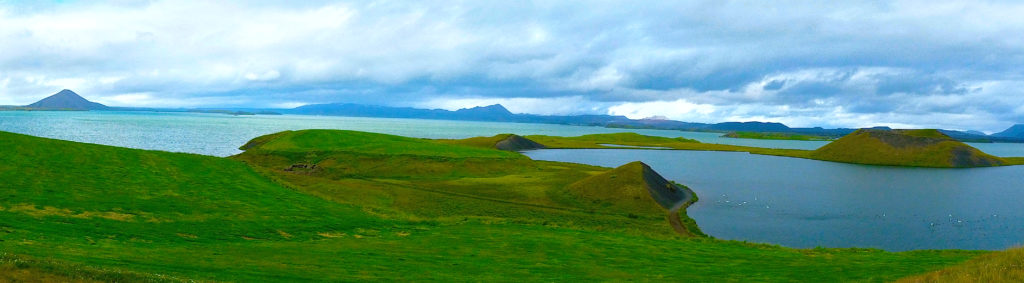
Echoes of these experiences are evident in traces left on the landscape and in the stories they wrote of their conquests in a language still spoken by their descendants. Hundreds of known archaeological sites, dozens of sagas, and a rich environmental record preserved in ice, soil, pollen, and ash attest to the myriad ways in which North Atlantic peoples adapted to their new homelands (cf. e.g. Fenger-Nielsen et al., 2019). However, despite this seeming wealth of evidence, reconstructing the lives, lifeways, and lived environments of premodern Norse people is not so simple. Whether a researcher wants to know about the rhythms of everyday life in medieval Norway, the economy of nineteenth century Northumbrian fishing communities, or how the settlement of Iceland in the late ninth century AD continues to impact its native ecosystems, they face a common set of problems: complex data about the past are always incompletely preserved, usually poorly integrated with other relevant datasets, and often simply difficult to access.
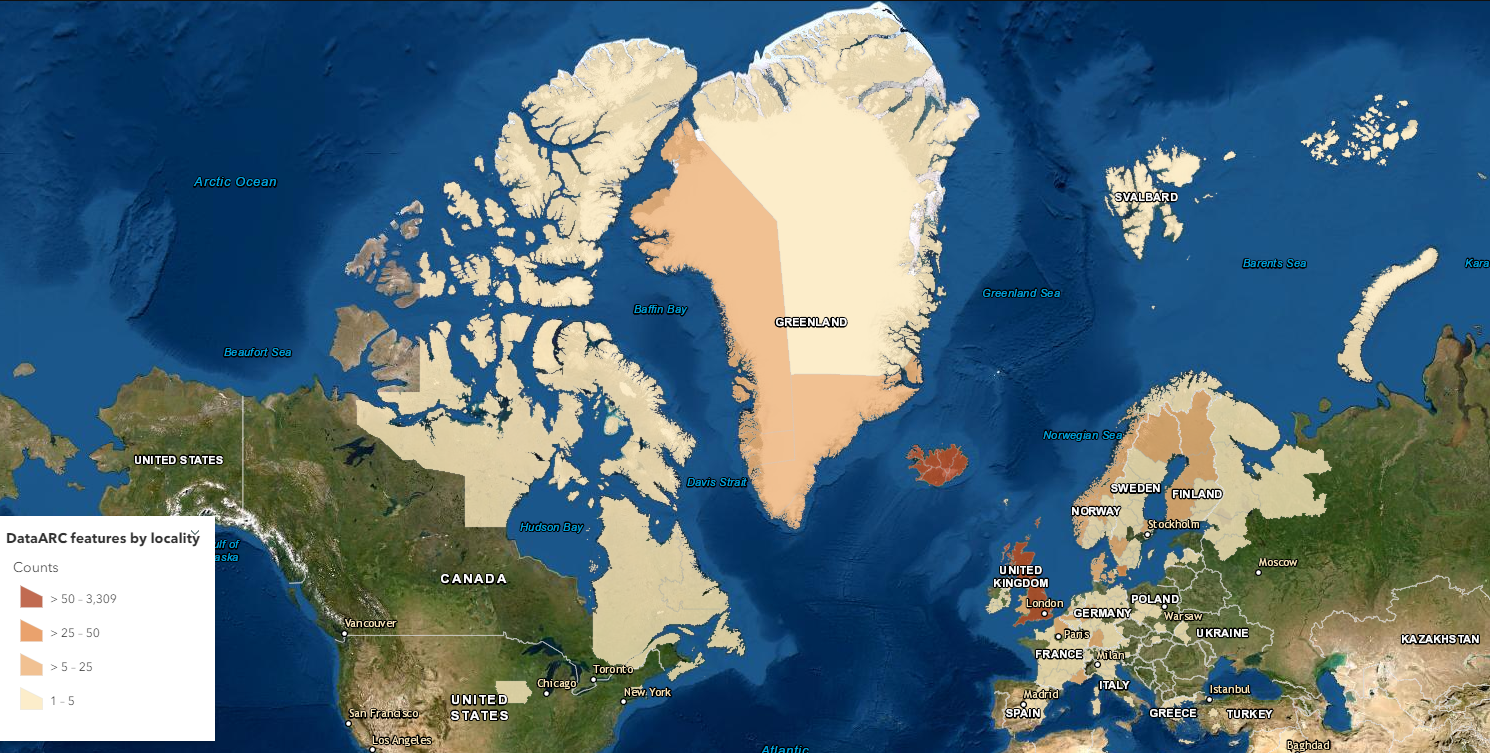
DataARC aims to remove these barriers by bringing together cultural, ecological, historical, and archaeological data from across the North Atlantic (Pálsson & Opitz, 2019). The project’s infrastructure currently connects together 15 different datasets related to life in the North Atlantic region, from geolocated artifacts and ecofacts to 19th-century land survey data to records of the volcanic ashfalls (tephra) that enable researchers to establish absolute chronologies for sites. DataARC’s infrastructure design focuses on the use of a “Concept Map” to knit together data from different sources that might nevertheless relate to the same central concept that a researcher is interested in, going beyond basic data aggregation and indexing.
The project’s concept map is built around the central theme of the ‘changing landscape’. Using a graph structure, it links together related concepts, for example explicitly connecting the ‘built environment’ to ‘church farm‘ to ‘ecclesiastical power‘ to ‘power’ to ‘saga narrative’. It was developed collaboratively through meetings and workshops over the course of three years, in which the set of key concepts needed to describe the group’s shared research domain were debated and refined. Each of these concepts is explained in a set of “scope notes” – documents that explain how concepts are understood by members of the research community, thereby promoting consistency in coding concepts between different researchers. Individual data contributors map subsets of their data to the specific concepts for which that data is most relevant. While data contributors working in different domains are likely to map their data to different concepts, the connections built into the concept map provide a way to connect their data together (Pálsson & Opitz, 2019). When anyone using the dataARC search tool requests data related to a specific concept, the tool also returns data mapped to concepts related to the one that was searched for, as well as concepts related to those linked concepts. The integration of related and contextual (related to related) concepts into the search results enables the system to mitigate the effects of the idiosyncratic ways in which individual researchers or research domains describe their data and define their own ‘key concepts’, which can easily lead to missed connections.
Removing barriers to the study of complex systems: the case of climate change
Encouraging this kind of data cross-pollination is important for research which relies on synthetic approaches and draws on data and expertise from multiple domains.
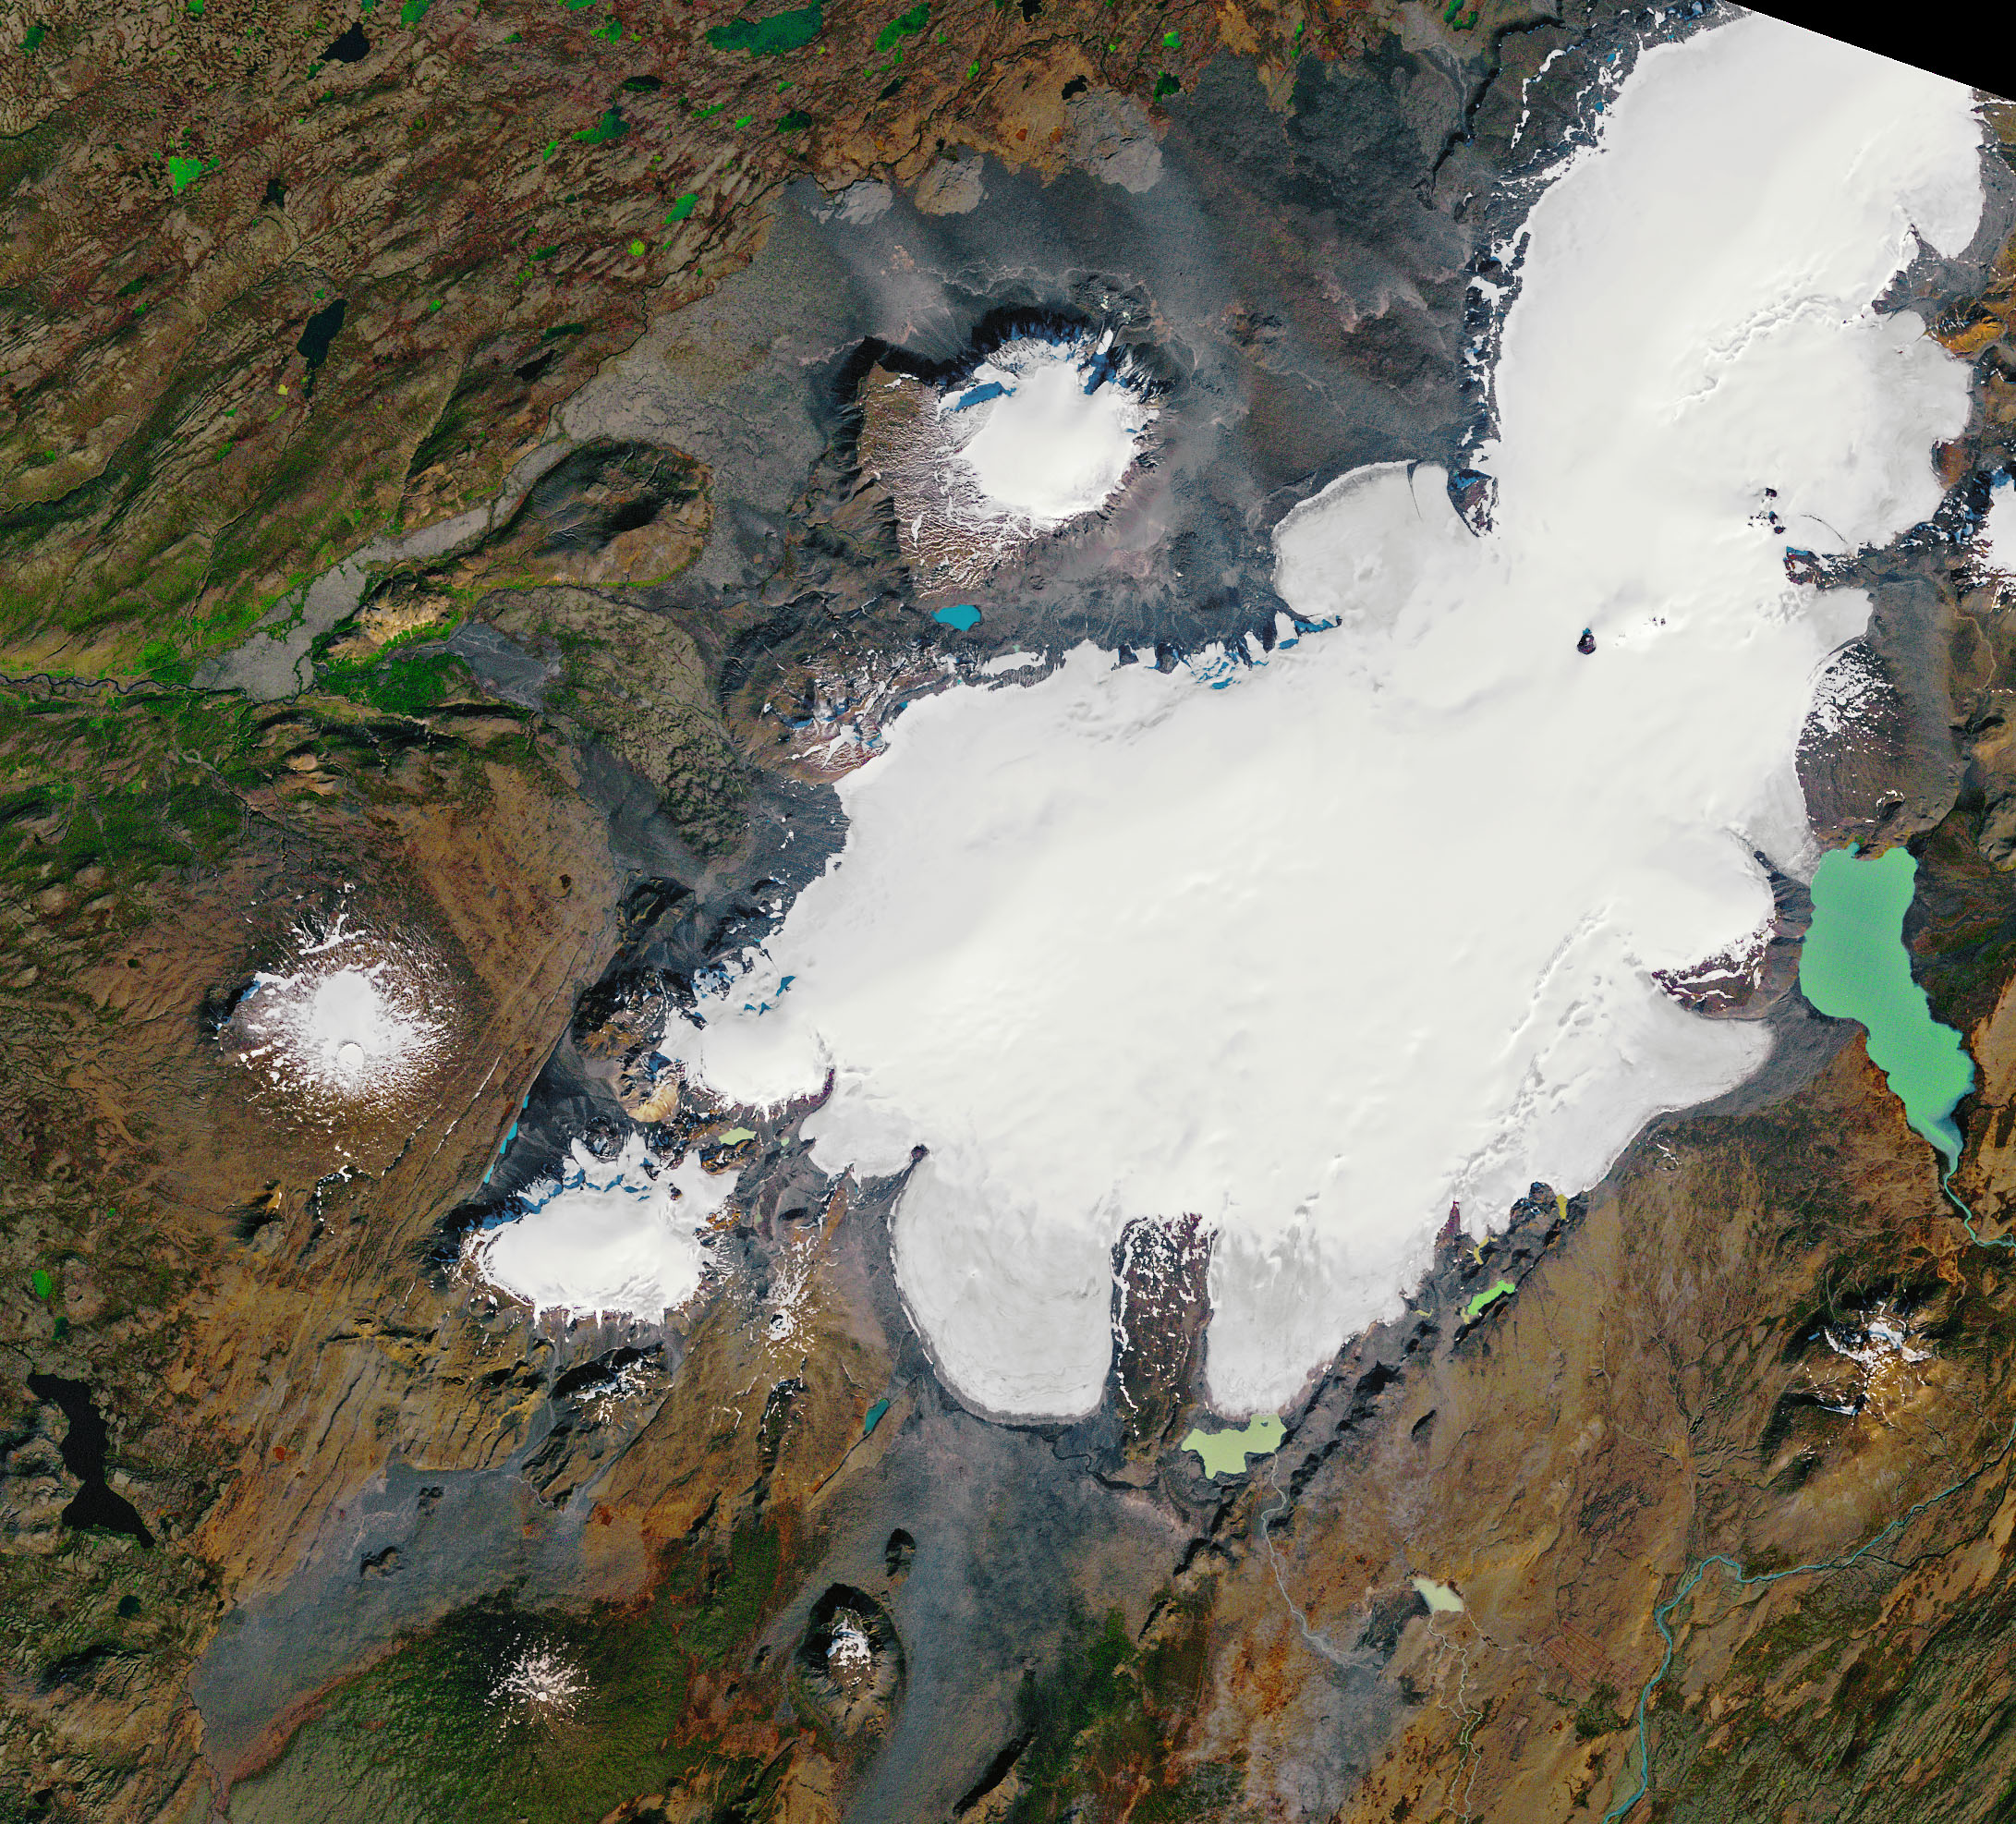
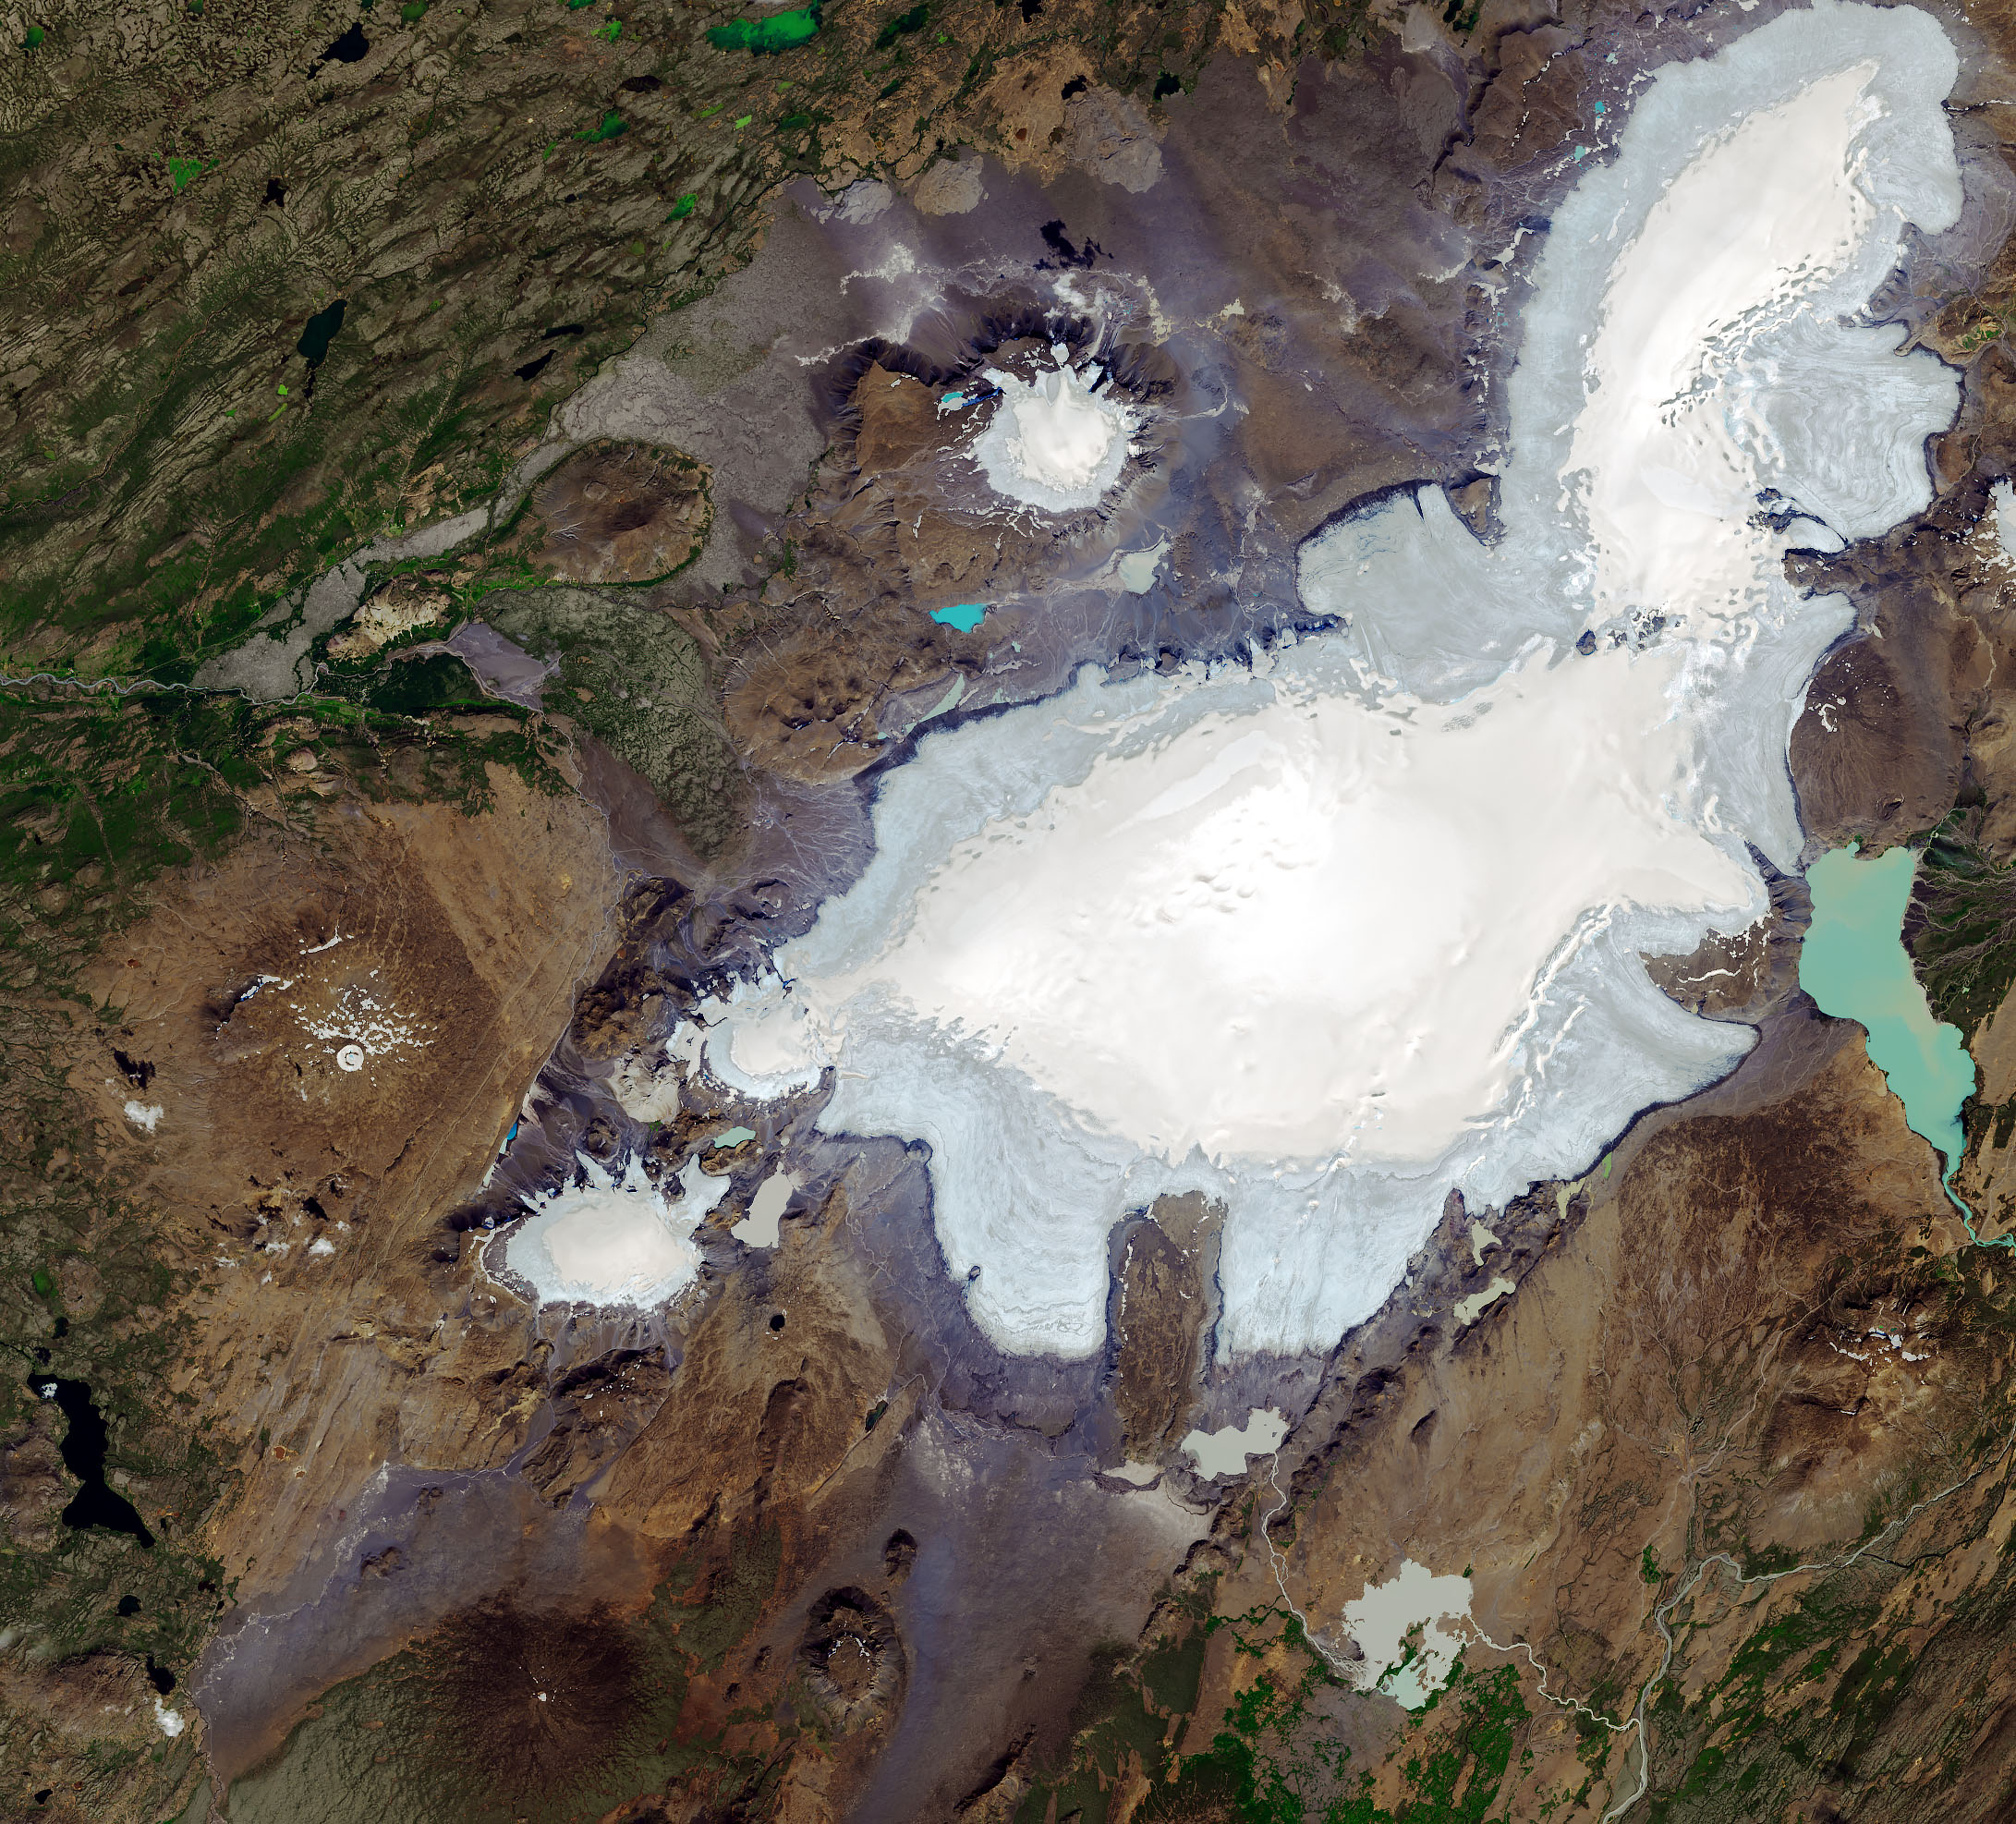
Okjökull glacier covers the top of Iceland’s Ok volcano on September 14th, 1986; by August 1st, 2019, only a remnant clings to the inside of the caldera. Lake Hvítárvatn, a significant source of climate data discussed in greater detail below, can be seen to the right of Langjökull glacier in both photos. Photos: NASA (LANDSAT 5/8). Swipe filter left and right to examine changes to the landscape.
Current efforts to clarify the role that a warming globe will have on the discovery, preservation, and interpretation of archaeological landscapes in the North Atlantic require the careful consideration of evidence from climatology and archaeology and are enriched through the integration of paleoenvironmental and textual sources of information on the character of the past landscape and its uses. Earth’s climate is changing, and – outside the Arctic and its marginal seas – nowhere is this process as apparent or rapid as in the North Atlantic (IPCC, 2020). From the retreat of glaciers to the slumping of permafrost and inexorably rising seas, these shifts threaten to reorganize delicate ecosystems, expose buried soils and artifacts to increased weathering, and reshape an already-dynamic landscape in potentially unwelcome ways (Hollesen et al., 2017; Fenger-Nielsen et al., 2020).
Climate in context: evidence from Iceland
The extent and speed of climate-related shifts, ephemeral as they are on the climatic timescale, are unprecedented in the experience of contemporary communities. These changes magnify patterns that past communities experienced. Close examination of what are known as climate proxies, indirect evidence of past climate conditions, allows researchers to investigate the degree and character of the differences between current and past climate regimes. Finding birch tree pollen in Icelandic lake-bottom sediments from 871 AD, for example, provides us with evidence that the climate, ecological conditions, and human activities in the area at that time supported a forest ecosystem long gone from the modern landscape. Proxies come in a number of biotic and abiotic forms, each of which corresponds to a greater or lesser degree to a particular aspect of climatic regimes: rainfall, minimum/maximum annual temperatures, storminess, predominant ecological communities, solar insolation, etc.
A quick reading of the North Atlantic’s climatic record over the last 10,000 years shows that few places on the planet rival Iceland for its recent exemplification of such climatic swings. During this period, generally referred to as the Holocene by researchers, the temperature of the North Atlantic island and its surrounding seas was prone to sizeable and often rapid shifts, as seen by concomitant changes in temperature-related climate proxies (e.g. Geirsdóttir et al., 2013). Even during the scant ~1,150 years since humans first set foot on the region’s last sizeable landmasses, the variability of the proxies discussed above indicate that climatic and ecological conditions in the North Atlantic have been in constant flux, including both abnormally warm and cool periods (Massé et al., 2008). Historical and archaeological records independently corroborate the portrait of a dynamic, challenging landscape painted by these proxies, noting a number of settlements across the region that failed at least due partially to changing climatic conditions (Dugmore et al., 2006; Dugmore et al., 2007).
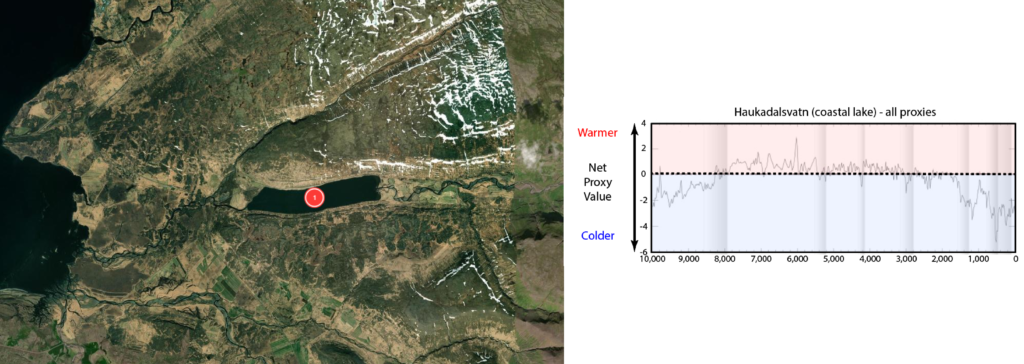
This coastal lake cored by Geirsdóttir et al. (2013) for analysis shows variation in temperature-related climate proxies over the last 10,000 years. If the summed values were a net positive (shaded in pink), higher than expected temperatures are inferred, while if they decrease (shaded in blue), lower than expected; shaded lines indicate significant short-term shifts. The pattern produced by this metric demonstrates both the long-term variability of Iceland’s climate and the rapidity with which it can shift. Note, however, that the temperatures at lake Haukadalsvatn are strongly affected by the nearby ocean, and the swings indicated by the summed proxies are therefore correspondingly lower in this core than in its twin from glacial lake Hvítárvatn.
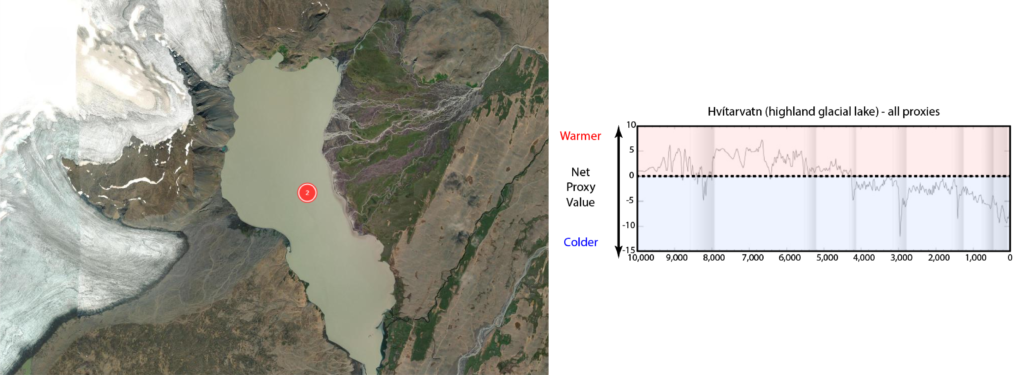
This high-altitude glacial lake cored by Geirsdóttir et al. (2013) for analysis shows significant variation in temperature-related climate proxies over the last 10,000 years. If the summed values were a net positive (shaded in pink), higher than expected temperatures are inferred, while if they decrease (shaded in blue), lower than expected; shaded lines indicate significant short-term shifts. Compared with the coastal site of Haukadalsvatn, Hvítárvatn shows a higher amplitude in its proxy’s values, but the overall pattern remains the same.
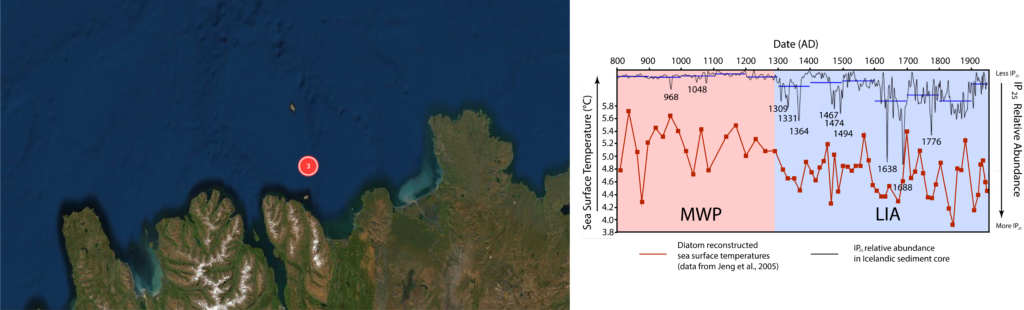
A sediment core collected in 1999 off the north coast of Iceland provided Massé et al. (2008) an opportunity to study climate variation over the last 1,000 years through the novel proxy IP25 – a chemical released only by algae living on sea ice. Increases in sea surface temperature as measured through the abundance of small temperature-sensitive sea creatures called diatoms during the Medieval Warm Period (MWP; ca. ~950-1250 AD) correspond with low abundance of IP25, while decreases in sea surface temperature during the Little Ice Age (LIA; ~1250-1900 AD) corelate well with increased IP25.
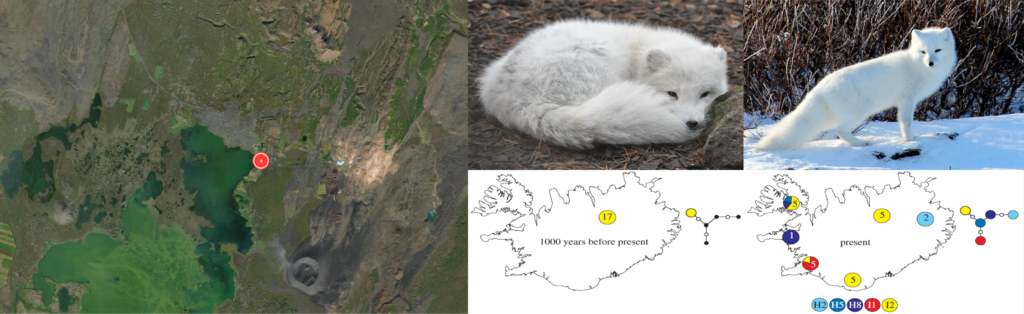
An example of a very different form of climate proxy than those retrieved from lake cores is the genetic diversity of the only mammal indigenous to Iceland, the Arctic fox (Vulpes lagopus) over time. Arctic foxes are known to disperse across sea ice during periods of nutritional stress in search for food, maintaining genetic links between populations able to make the crossings. The level of differentiation observed in different populations therefore indirectly signals the expansion or retreat of sea ice. By comparing 17 individual Arctic fox skeletons recovered from 9th-12th century sites around Lake Mývatn to 23 modern specimens, Mellows et al. (2012) showed that while the sampled ancient foxes were all part of a single descent group (haplotype I2, yellow in figure), modern foxes contain descendants of at least five different populations (haplotypes H2, H5, H8, and I1, different colored circles in figure). This pattern indicates a period of heightened regional connectivity at some point between the youngest ancient fox skeleton in the archaeological sample and the oldest modern foxes. This signal, suggestive as it is of a colder period that allowed more sea ice, is consistent with the measurements taken of temperature during the “Little Ice Age” from the lakes and seafloor sediment cores explored above.
Evaluating the future in light of the past
“So, wait”, you might reasonably say, “which is it? Is climate change an existential threat to evidence which can provide insights into the lives of past communities and their engagements with the landscape in the North Atlantic, or is it the latest in a long series of changes to the climate and landscape, to which communities, human and non-human, have adapted?”
Even under the most catastrophic scenarios envisioned by the Intergovernmental Panel on Climate Change (IPCC), the North Atlantic will still have plenty of islands, ecosystems, people, and archaeological sites. Indeed, not only is climate change not the end of Icelandic archaeology, but new evidence from the settlement period is being discovered regularly across the country, often outstripping resources available to thoroughly investigate it.
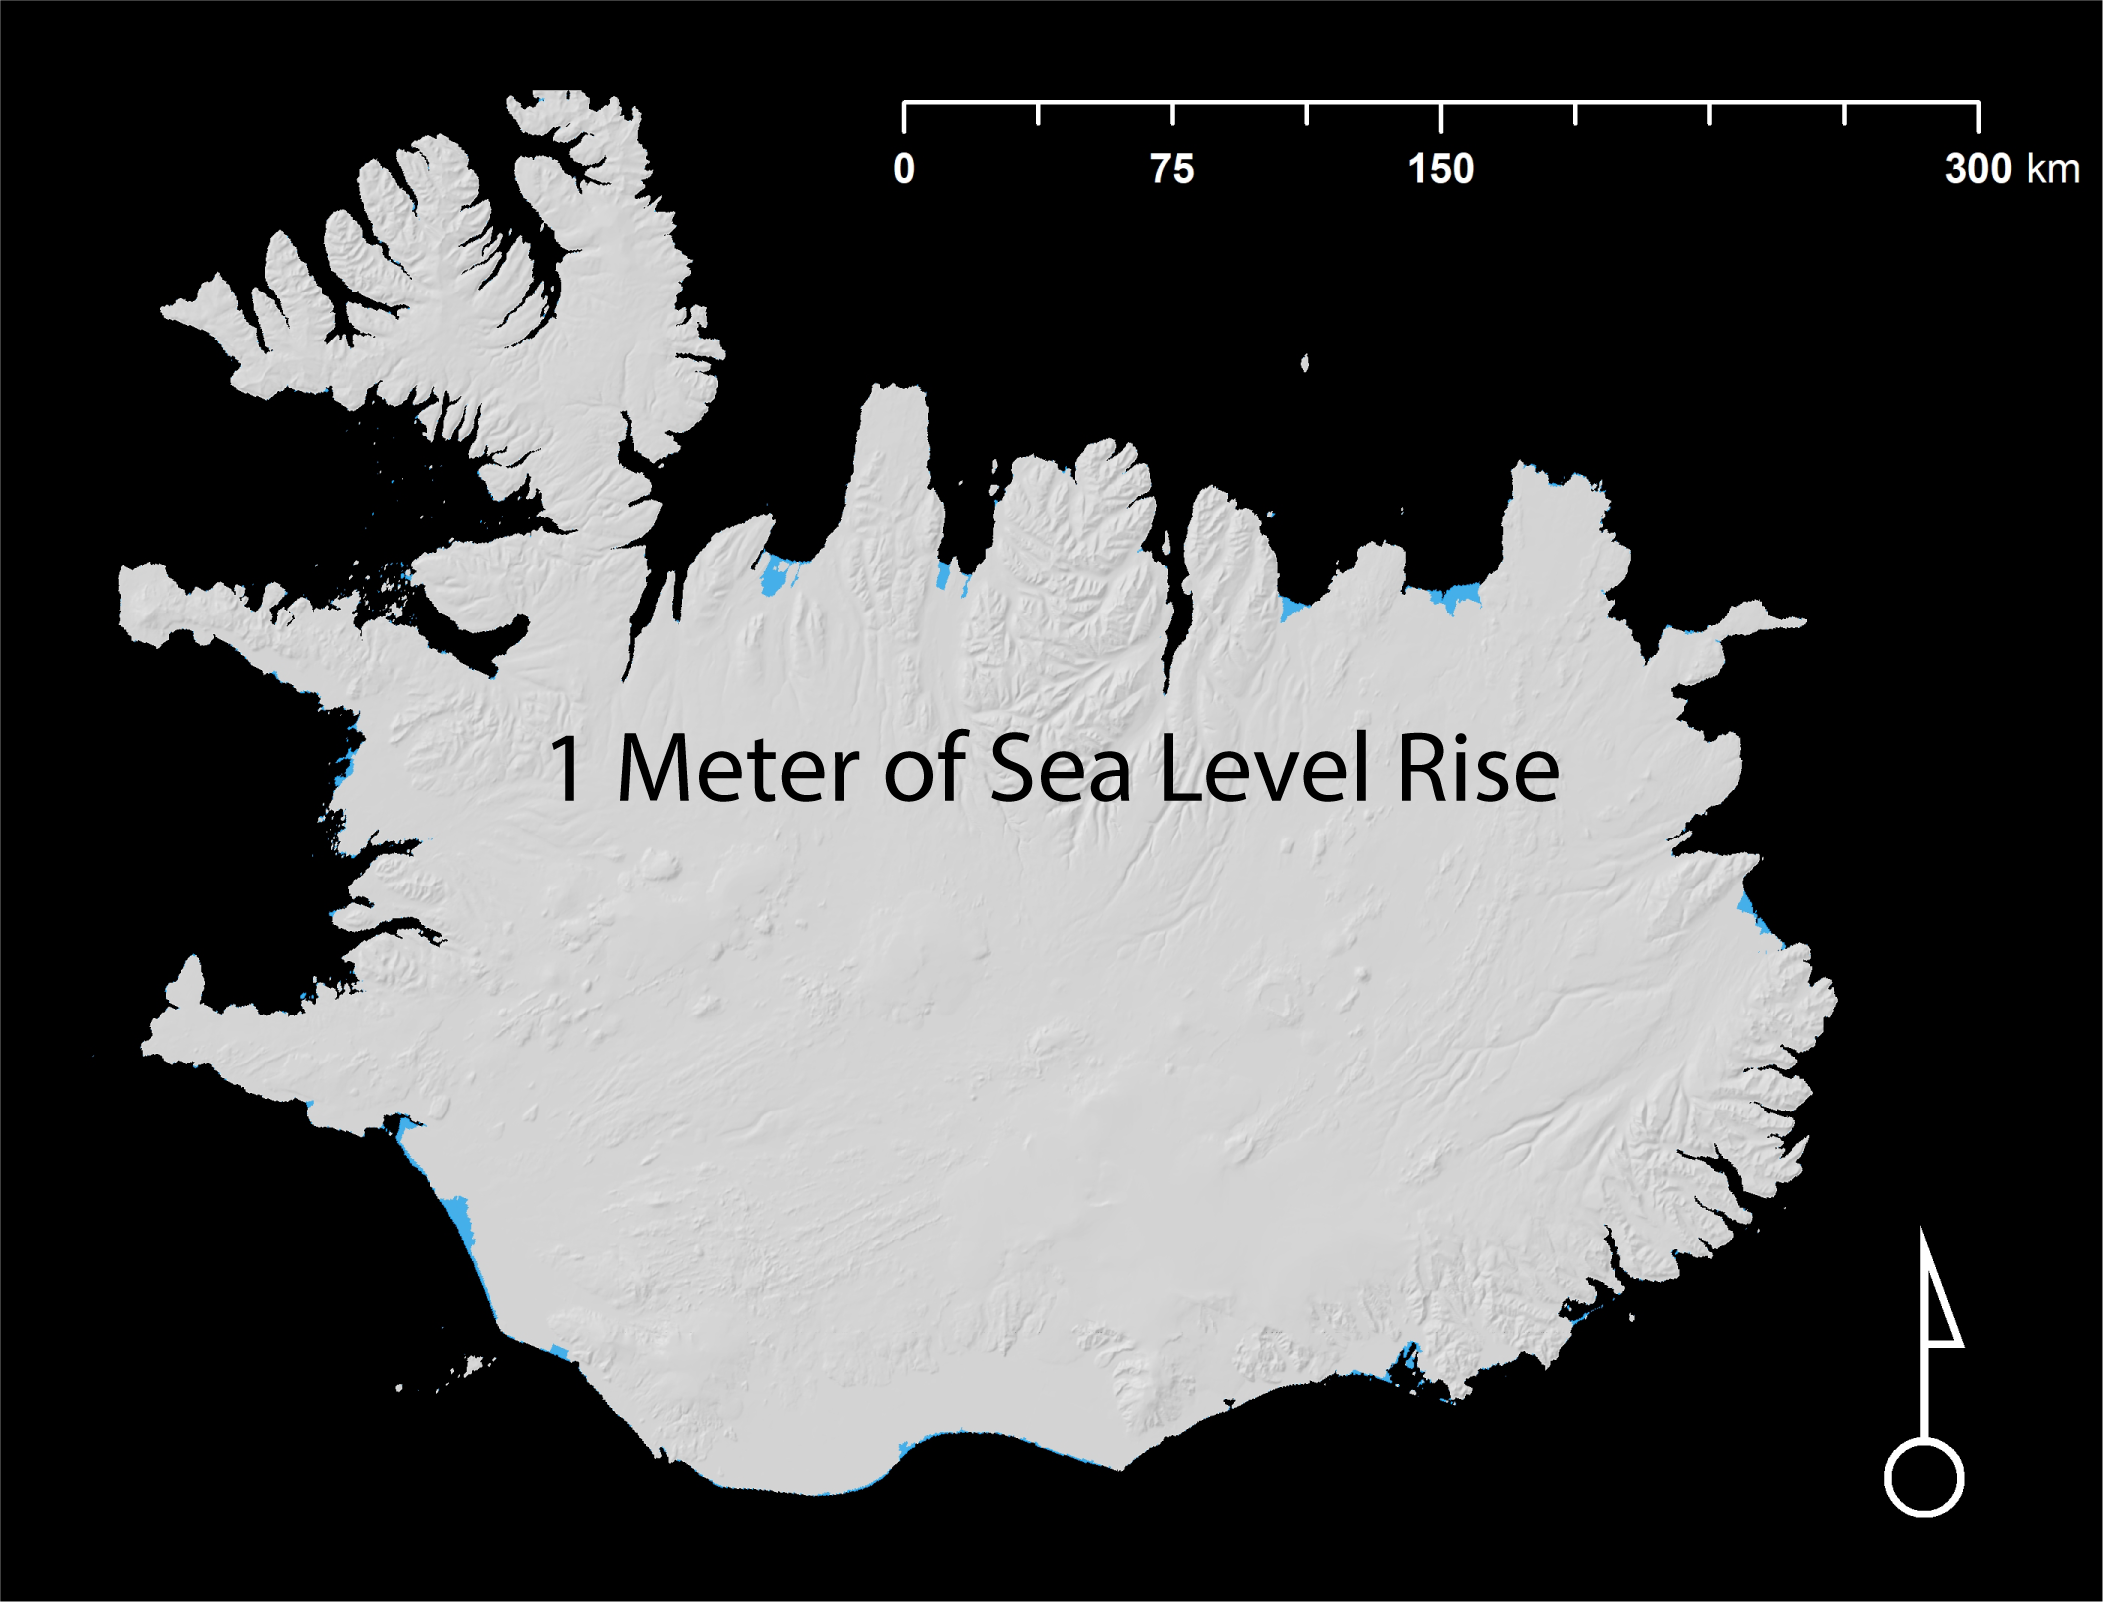
Neither middle-of-the-road (1 meter, left) or extremely high-end (7 meters, right) projections for sea-level rise by 2100 pose a large risk to the majority of Iceland’s archaeological heritage. Swipe left and right to view areas of Iceland predicted to be inundated under each scenario.
What is threatened is therefore not the body of archaeological sites as a whole, but a specific subset of them: those that are most exposed and/or sensitive to marginal changes in environmental variables. As seen in the lake core proxies, conditions at the same time at different sites across the North Atlantic can vary considerably and shifts tend to be rapid. Sites that are (e.g.) near the coast may be buffered against temperature, but will be pounded away by the tides and eroded by increased rainfall and wind brought by stronger storms, taking with them much of the evidence of activities that are normally limited to those environments – wharves, fishing stations, and riverside hamlets. Using a combination of geospatial information on the locations of identified sites derived from dataARC and models of likely sea level rise, we can isolate which (known) coastal sites are at risk from this effect of climate change.
Some examples of organic materials recovered from archaeological sites in the North Atlantic whose preservation will likely worsen due to climate change. Clockwise from top-center: (1) rodent-gnawed sheep or goat radius (Pálsdóttir, 2019:8), (2) charred fucus-type seaweed pods (Mooney, 2018:4), (3) degraded oak from the Litlu-Núpar boat grave (Mooney, 2013:174), (4) barley seeds from a midden (Trigg et al., 2009:69), and (5) a fragment of an apron from a 10th century woman’s grave (Ívar Brynjolfsson in Hayeur Smith et al., 2019:107).
Conversely, elevated areas protected from sea level rise often have cold environments that preserve organic materials such as wood, fiber, bone, and seeds much like a refrigerator preserves food, keeping the level of decomposition and disturbance relatively low. Increasing temperatures will lead to less recovery of organic remains from archaeological sites – materials which preserve important information about everything from cultural mores and dietary habits to patterns of climate change and the extent of trade networks (Hollesen et al., 2016). Open-source climate projections such as the Community Climate System Model (CCSM) allow scientists to predict which regions are at greatest risk of warming, when, and prioritize them for further study and preservation accordingly.
A comparison of the effects of four potential climate scenarios from the Intergovernmental Panel on Climate Change (IPCC) on Iceland’s mean average annual temperature in both 2050 and 2070. Note that due to different assumptions about the rate of decarbonization, RCP 4.5 appears to result in worse outcomes than RCP 6.0 in 2050, but that both scenarios resolve in similar warming by 2070.
In addition to the detrimental effects on preservation caused by temperature fluctuations and flooding resulting from anthropogenic climate change, further source of evidence are at risk due to other ongoing processes both natural and human – everything from the impact of new construction on landslides to the risks posed by climate-related changes less directly addressed than sea level rise (e.g. increased storminess speeding soil erosion). Though pedestrian threats to sites get less press than those more directly tied to the impending climate catastrophe, these conflicts are present in all regions and countries, and neither the North Atlantic nor Iceland are exceptions. DataARC’s Environmental Risks to Icelandic Sites (ERIS) database maintains a partial list of at risk sites in Iceland and the issues they face, along with relevant information about their associated artifacts and temporal phase(s). This dataset has been mapped to dataARC’s concept map by its contributor, Gisli Pálsson.
By taking the set of all sites for which dataARC has data and filtering it through the three independent criteria of (i) temperature, (ii), flooding, and (iii) inclusion in the ERIS database, we can rapidly build a list of sites that may merit prioritisation for enhanced study or preservation-oriented work.
Extending risk analysis through concept mapping
Combining dataARC’s data source locations with the external and internal climate datasets to create this map provides a useful jumping off point for studies aiming to prioritise locations for preservation works. Beyond a basic understanding of the character of any physical remains at these locations, the themes and questions about which the research community believes these places may provide insights objects are essential considerations for the development of both research and preservation strategies.
The concept mappings provided through dataArc enable an exploration of the kinds of questions these at risk sources of information might be used to address. As described above, each data point in dataARC is linked to one or more “concepts” about which its contributor believes it provides information. While we previously discussed how connections between these concepts can be used to draw out strings of related data that may be buried in disparate datasets to answer particular questions, studying their distribution in relation to external datasets can be informative as well. In the analysis conducted above, sites in dataARC were selected based on criteria either external to dataARC (temperature/flooding) or their inclusion in a specific dataset (Environmental Threats to Icelandic Sites), but it did not account for the mappings to the concepts of (e.g.) “erosion“, “land degradation“, or “temperature” contributed by the project’s domain experts. An examination of the distribution of concepts to which these at-risk sites are connected can better inform our understanding.
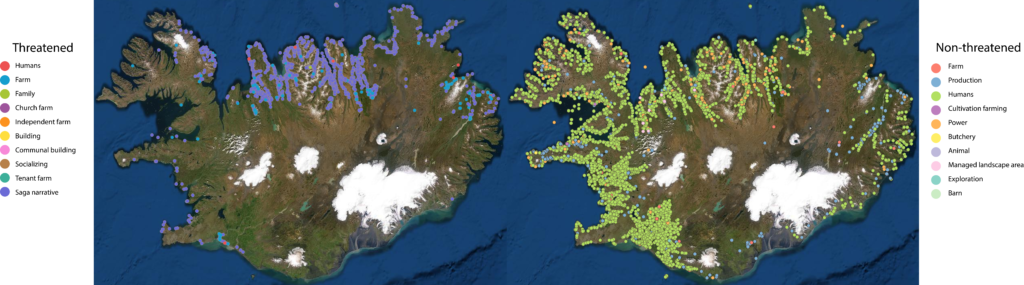
An examination of the resulting map reveals that only two concepts are shared in the top ten most frequent concepts associated with both all threatened sites and all non-threatened sites: “humans” and “farm“, reflecting the dominance of agrarian related data sources in the project’s data collection. While the presence of non-overlap in the other eight categories is insufficient evidence to draw any firm conclusions, we can speculate as to potential reasons behind the differences in concept frequencies for each type of site as a preliminary hypothesis-building exercise. For instance, the prevalence of saga sites in the “threatened” class may reflect the tendency of early settlers to ascribe particular meaning to, and therefore write, about the coast or other easily accessible, ecologically productive, and rapidly changeable hydrological features such as lakes and fjords. Non-threatened sites display a number of concepts associated with travel and production (“exploration“, “cultivation farming“) and animal husbandry (“animal“, “barn”, “butchery“) while several terms connected to social structures (“family“, “socializing“, “communal building“) are more evident in the “threatened” set. While it is difficult to say what these differences imply, it does seem that the kinds of concepts associated with the threatened and non-threatened sites are meaningfully different.
Differences in the concepts associated with each site type continue well past the top ten most frequent concepts. Using simple tools such as the word clouds below (as well as more complex forms of data science), we can explore further into the data, shoring up initial observations and allowing us a little more confidence in our hypothesis generation.
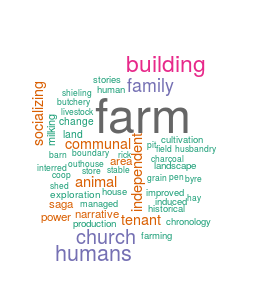
Threatened: temperature 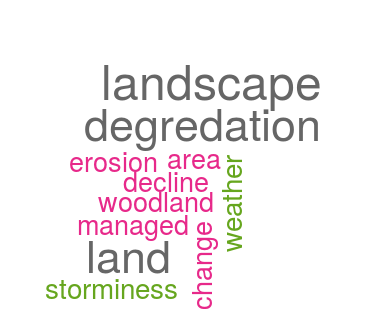
Threatened: other 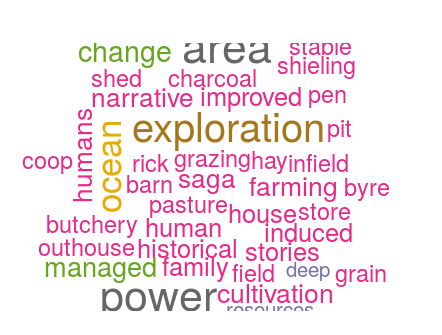
Threatened: flooding 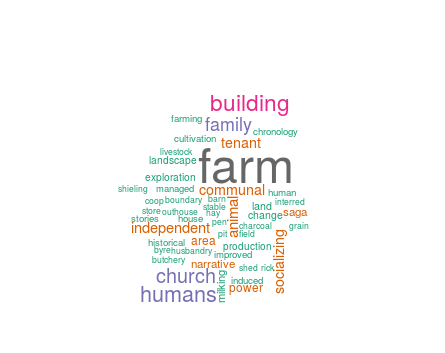
Threatened: all 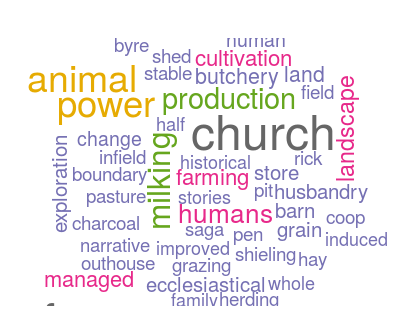
Non-threatened: all
Like the concepts mapped above, the word clouds for the threatened and not threatened sites share several themes. Farms, humans and churches play important roles in both – a testament to the common factors important throughout Iceland and across different datasets. A number of interesting and potentially research-worthy differences do emerge, however. Concepts such as “independent,” “family”, “socializing”, “narrative,” “tenant,” and “communal” evoke the social aspects of life in a traditional agricultural community and are common in “threatened sites”. Meanwhile, the theme in concepts related to the “unthreatened” sites is the production aspects of life in an agricultural community, with concepts such as “butchery”, “exploration”, “milking,” “production”, “cultivation”, and “managed” abounding.
Observations from these word clouds are tools that can start a researcher on the road to formulating hypotheses that can then be tested with in-depth analyses, rather than constituting the end product in-and-of themselves. Although this limitation should caution us away from making any definitive statements, as an engine for deriving new questions and hypotheses it can be quite powerful. For instance, many of the at-risk sites are located in low-lying regions with warmer climates and close to the ocean—some of the same attributes that would make them appealing for settlement. Similarly, the less at-risk sites are likely farther away from populated, connected places in Iceland, requiring a greater energetic expenditure on basic production and subsistence. We might therefore hypothesize that at-risk locations are more likely to have more developed infrastructure and social networks, allowing for more complex types of interaction between people, as reflected in the presence of more emphasis on sociality. This hypothesis could then be tested through detailed examinations of the actual artifacts, ecofacts, and histories linked in the associated concepts.
Conclusions and a cautionary note
Researchers working on the North Atlantic region have made significant long-term investments in collaborations and joint research efforts, but the real practical difficulties in integrating interrelated datasets continues to act as a barrier to transdisciplinary research and to developing shared understandings of the past. By providing both data and tools to explore connections between them through shared concepts, dataARC allows researchers, data scientists, and the interested public to ask questions and investigate multiple lines of evidence about the North Atlantic’s past.
What it does not do – in fact, what no database source can do – is alert the user to all the hidden biases that may shape the data. Factors as simple as differential road access to sites, poor fit between a particular climate proxy and given purpose, or the particular research interests driving specific projects can undermine assumptions fundamental to a given model, and may create misleading patterns or trends when viewing data in aggregate. As seen in the limited spatial distribution of sites in dataARC’s own Environmental Threats to Icelandic Sites database relative to the set of dataARC-indexed at-risk sites revealed by the combined climate analysis, the entirety of a single dataset usually represents the effort of the collecting research team rather than the totality of available evidence. To alert users to some (but not all!) of these biases, the “why?” section of dataARC’s search tool user interface’s “Combinator details” section contains a description of potential issues with data. For example, the combinator “Potential insect evidence for dung” reads “Potential insect evidence for dung, but some species could be attracted to environments which are similar to dung (foul stuff).”. Caveats such as this are a key consideration for scientists striving to discover the hitherto unknown connections facilitated by dataARC while avoiding overreach in their interpretation of the linked data.
These gaps further reinforce the need for the data infrastructure dataARC provides for the North Atlantic research community. By weaving evidentiary strands together, dataARC enables researchers to both explore connections previously not considered and notice when a purportedly “complete” dataset is missing data by contrast with its conceptual relatives. As the dataARC community grows its data and user base, these already-invaluable functions will continue to improve, helping anyone invested in the North Atlantic understand the past, appreciate the present, and plan for the future.
External resources
- Worldclim (v2.1 modern, v1.6 historic)
- Digital Elevation Model (DEM) of Iceland
Bibliography
- Barlow, L. K., Sadler, J. P., Ogilvie, A. E., Buckland, P. C., Amorosi, T., Ingimundarson, J. H., Skidmore, P., Dugmore, A.J., & McGovern, T. H. (1997). Interdisciplinary investigations of the end of the Norse Western Settlement in Greenland. The Holocene, 7(4), 489-499.
- Barraclough, E. R. (2012). Naming the Landscape in the Landnám narratives of the Íslendingasögur and Landnámabók. Saga-Book, 36, 79-101.
- Dugmore, A. J., Church, M. J., Mairs, K. A., McGovern, T. H., Newton, A. J., & Sveinbjarnardóttir, G. (2006). An over-optimistic pioneer fringe? environmental perspectives on medieval settlement abandonment in Þórsmörk, South Iceland. Aarhus University Press.
- Dugmore, A. J., Keller, C., & McGovern, T. H. (2007). Norse Greenland settlement: reflections on climate change, trade, and the contrasting fates of human settlements in the North Atlantic islands. Arctic anthropology, 44(1), 12-36.
- Fenger-Nielsen, R., Hollesen, J., Matthiesen, H., Andersen, E. A. S., Westergaard-Nielsen, A., Harmsen, H., Michelson, A., & Elberling, B. (2019). Footprints from the past: The influence of past human activities on vegetation and soil across five archaeological sites in Greenland. Science of The Total Environment, 654, 895-905.
- Fenger?Nielsen, R., Elberling, B., Kroon, A., Westergaard?Nielsen, A., Matthiesen, H., Harmsen, H., Madsen, C.K., Stendel, M., & Hollesen, J. (2020). Arctic archaeological sites threatened by climate change: A regional multi?threat assessment of sites in south?west Greenland. Archaeometry, 62(6), 1280-1297.
- Geirsdóttir, Á., Miller, G. H., Larsen, D. J., & Ólafsdóttir, S. (2013). Abrupt Holocene climate transitions in the northern North Atlantic region recorded by synchronized lacustrine records in Iceland. Quaternary Science Reviews, 70, 48-62.
- Hollesen, J., Matthiesen, H., Møller, A. B., Westergaard-Nielsen, A., & Elberling, B. (2016). Climate change and the loss of organic archaeological deposits in the Arctic. Scientific Reports, 6(1), 1-9.
- Hollesen, J., Matthiesen, H., & Elberling, B. (2017). The impact of climate change on an archaeological site in the Arctic. Archaeometry, 59(6), 1175-1189.
- Massé, G., Rowland, S. J., Sicre, M. A., Jacob, J., Jansen, E., & Belt, S. T. (2008). Abrupt climate changes for Iceland during the last millennium: Evidence from high resolution sea ice reconstructions. Earth and Planetary Science Letters, 269(3-4), 565-569.
- Mellows, A., Barnett, R., Dalén, L., Sandoval-Castellanos, E., Linderholm, A., McGovern, T. H., Church, M.J., & Larson, G. (2012). The impact of past climate change on genetic variation and population connectivity in the Icelandic arctic fox. Proceedings of the Royal Society B: Biological Sciences, 279(1747), 4568-4573.
- Mooney, D. E. (2018). Charred fucus-type seaweed in the North Atlantic: A survey of finds and potential uses. Environmental Archaeology, 1-13.
- Pálsdóttir, A. H., & Skarphéðinsson, I. (2019). The Animal Bones from Litlibær, Nes, Iceland.
- Pálsson, G. and Opitz, R. (2019) DataArc: a case study using CIDOC CRM as an ontology for transdisciplinary research. In Niccolucci, F. and Richards, J. (2019) The ARIADNE Impact, Archaeolingua Foundation, Hungary.
- Sigurgeirsson, M. Á., Hauptfleisch, U., Newton, A., & Einarsson, Á. (2013). Dating of the Viking Age landnám tephra sequence in Lake Mývatn sediment, North Iceland. Journal of the North Atlantic, 2013(21), 1-11.
- Smith, M. H., Smith, K. P., & Frei, K. M. (2019). ‘Tangled up in Blue’: The Death, Dress and Identity of an Early Viking-Age Female Settler from Ketilsstaðir, Iceland. Medieval Archaeology, 63(1), 95-127.
- Trigg, H., Bolender, D., Johnson, K. M., Patalano, M. D., & Steinberg, J. M. (2009). Note on barley found in dung in the lowest levels of the farm mound midden at Reynistaður, Skagafjörður, Iceland. Archaeologia Islandica, 7, 64-73.